Who Draws the Map? Voters Weigh In
A majority of voters oppose states redrawing congressional maps specifically to gain partisan seats, and 55% support independent redistricting commissions over state legislatures. But when the August 2026 Compass Poll asked voters to describe a fair congressional map in their own words, many could not.
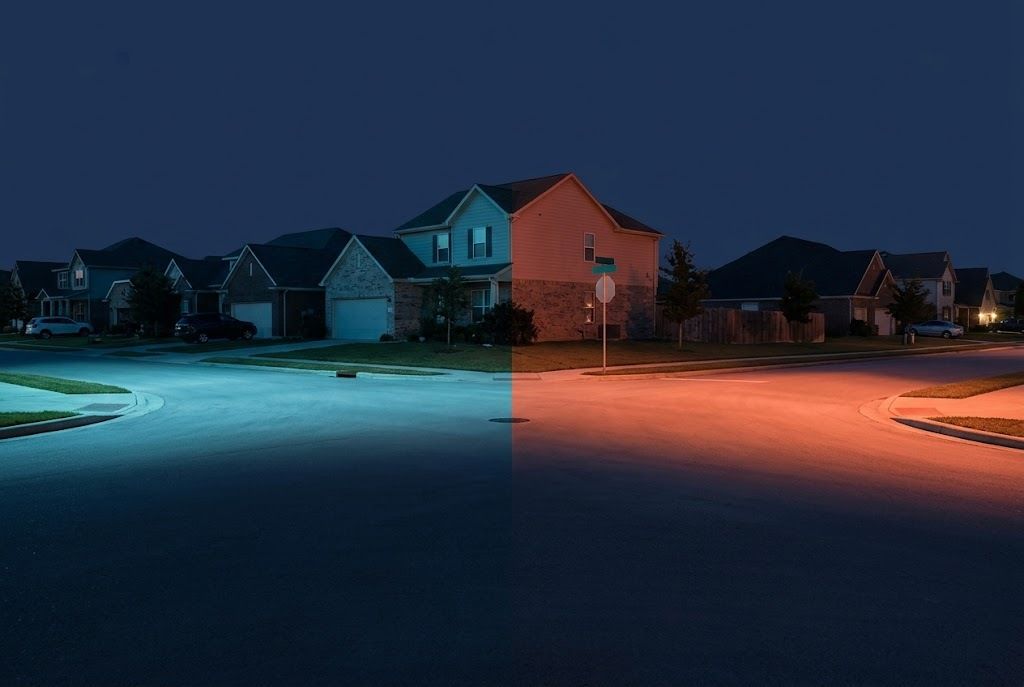
This year, Texas Republicans and California Democrats rewrote their congressional maps. Not because a census required it, but because both parties wanted more seats going into the 2026 midterms. A Change Research national survey of 2,045 registered voters, conducted August 8 through 13, 2026, with a modeled margin of error of ±2.3 percentage points, finds that most voters oppose the practice. Their picture of what should replace it is less clear.
The mid-decade map fights are part of a broader redistricting moment. In May, we surveyed voter reaction to the Supreme Court's ruling in Louisiana v. Callais, which narrowed how states can use race as a factor in drawing districts. Courts have been involved in legal challenges to new maps in Texas and California since then.
Opposing Partisan Redistricting
54% of voters oppose states redrawing congressional districts outside the normal once-a-decade process when the stated goal is gaining more seats for one party. Opposition is highest among Democrats (68%) and independents (57%). Among Republicans, it tips the other way: 44% support partisan mid-decade redistricting, while 39% oppose it.
"Why change things if they aren't broken? Just to get more votes or keep your party in power is the very thing that is ruining this great nation!"
White Woman, 35 to 49, Independent
"One that divides a state by common regions instead of dividing due to political beliefs or along racial lines!"
White Man, 65+, Republican
Support for Independent Commissions
55% of voters support using independent commissions to draw congressional districts in every state, rather than leaving that power with state legislatures. 20% oppose it, and 26% are not sure.
Democrats are most supportive at 65%, Republicans follow at 50%, and independents trail both at 37%. Independents also have the highest "not sure" rate of any partisan group, at 43%.
"Throw out both sides' partisan redraws. Maps should be generated by an independent commission based on the state's population, constitutionally required minority voting protections, community preservation, and reasonable compactness, without optimizing for election results."
Black/African American Woman, 35 to 49, Democrat
"A fair map would be one drawn by an independent, non-partisan or equally bipartisan commission that gives attention to geography, proportionality, and competitiveness."
White Man, 50 to 64, Republican
Who Voters Think Is “Winning”
36% of voters say Republicans are winning the current redistricting fights. 16% say Democrats, and 24% say neither party has the advantage. Another 24% are not sure.
Those views follow party lines closely. 56% of Democrats say Republicans benefit most. Republicans are more divided: 25% point to Democrats, while 32% say it is about even, compared to 17% of Democrats who say the same.
Defining a “Fair” Map
The August poll asked voters to describe a fair congressional map in their own words. More than 500 responded. A meaningful share said they did not know, were not sure, or would need to learn more before answering.
"I am not sure, I wouldn't feel comfortable answering that without digging more into it myself."
White Man, 18 to 34, Democrat
Among those who offered a description, the most common themes were geographic and population-based: districts should follow where people actually live, trace county or city lines, and not be drawn to benefit either party. Many respondents, from both parties, described the shape of a district as the most visible marker of fairness.
"Voting blocks, not crazy zig zag, pie triangles out of cities that stretch into rural areas diluting city votes with folks who never go to the city."
White Man, 50 to 64, Independent
Others focused on what the outcome of a map should produce, rather than how it looks.
"Competitive and not blatantly designed to benefit one party or another."
White Man, 35 to 49, Independent
A smaller share specifically cited independent commissions or nonpartisan processes. The most articulate responses cut to the underlying principle.
"A fair congressional map is one in which voters choose their representatives, not one in which politicians carefully select the voters who will keep them in office."
Hispanic/Latino Man, 50 to 64, Democrat
Methodology
Polling was conducted online from August 8 to 13, 2026. Using Dynamic Online Sampling to attain a representative sample, Change Research polled 2,045 registered voters nationally. The modeled margin of error is ±2.3 percentage points. Members of AAPOR's Transparency Initiative disclose all relevant details about our research, with the principle that the public should be able to evaluate and understand research-based findings, in order to instill and restore public confidence in survey results.
See the full data behind this poll
Sign up for the award winning Change Research Data Portal to gain insights like these every month with new polling.