Crooked Media/Change Research National Poll of Registered Voters: January 22-23, 2021
KEY INSIGHTS
- Voters want COVID-19 to literally be the number 1, 2, and 3 priorities for the Biden administration. Voters’ clear top priorities are controlling the virus, distributing the vaccine, and getting economic relief to the American people. In our open-ended question, decent numbers of voters also mention immigration, healthcare, and climate. In our multiple choice question, COVID policies are trailed only slightly by holding Trump accountable and combating rampant voter fraud.
- Joe Biden’s agenda is extremely popular. From the $1.9 trillion rescue package to the voting reforms in the For the People Act and beyond, most of Biden’s top priorities are supported by at least 60% of registered voters, and some have nearly 70%. It can’t be overstated what a huge deal this is in the current polarized era: Trump’s policy proposals rarely broke 50%.
- Voters overwhelmingly reject Republican obstruction, and want Democrats to do what’s necessary to bring relief to struggling Americans and end the pandemic. Voters favor eliminating the filibuster by an 8-point margin, and if Republicans used the filibuster to block a $15 minimum wage, they’d support ending it by a 14-point margin (not a filibuster-proof majority, but Americans’ feelings are clear). And twice as many voters will be unhappy if Mitch McConnell and Republicans block Democrats from passing any laws as will be happy. 24% of Trump voters don’t know how they’d feel if McConnell blocked everything, while only 3% of Biden voters say the same. Another 24% of Trump voters would have negative feelings in the face of such obstruction — while 89% of Biden voters would feel negative. In other words, the political price Democrats will pay for bending to Republican obstruction is far greater than the price they’ll pay for changing the rules to pass legislation by a simple majority.
- Democratic voters remain much more fired up than Republicans. Democrats are substantially more enthusiastic about voting in 2022 (18% of Trump voters rate their enthusiasm 1, 2, or 3 out of 10, compared with 5% of Biden voters; and 56% of Biden voters rate theirs as 10, versus 50% of Trump voters). And as noted above, we see an enthusiasm differential in the obstruction question, as well. We should not assume that Democrats are going to become less enthusiastic about politics and voting just because Trump is no longer President. And again: Democrats and a significant number of Republicans want Democrats to pass their agenda.
- Believe in Biden’s win and support for Biden’s policies among Republicans varies widely by news source. Only 9% of Trump voters believe Biden got more votes. On this and many other questions, there are wide disparities between OAN/Newsmax viewers and Fox viewers, as well as between Trump voters who watch these three networks and those who don’t. However, there are still consequential numbers of Trump voters who support Biden’s policies, acknowledge some basic facts, oppose the insurrection, and disavow QAnon.
BIDEN’S AGENDA
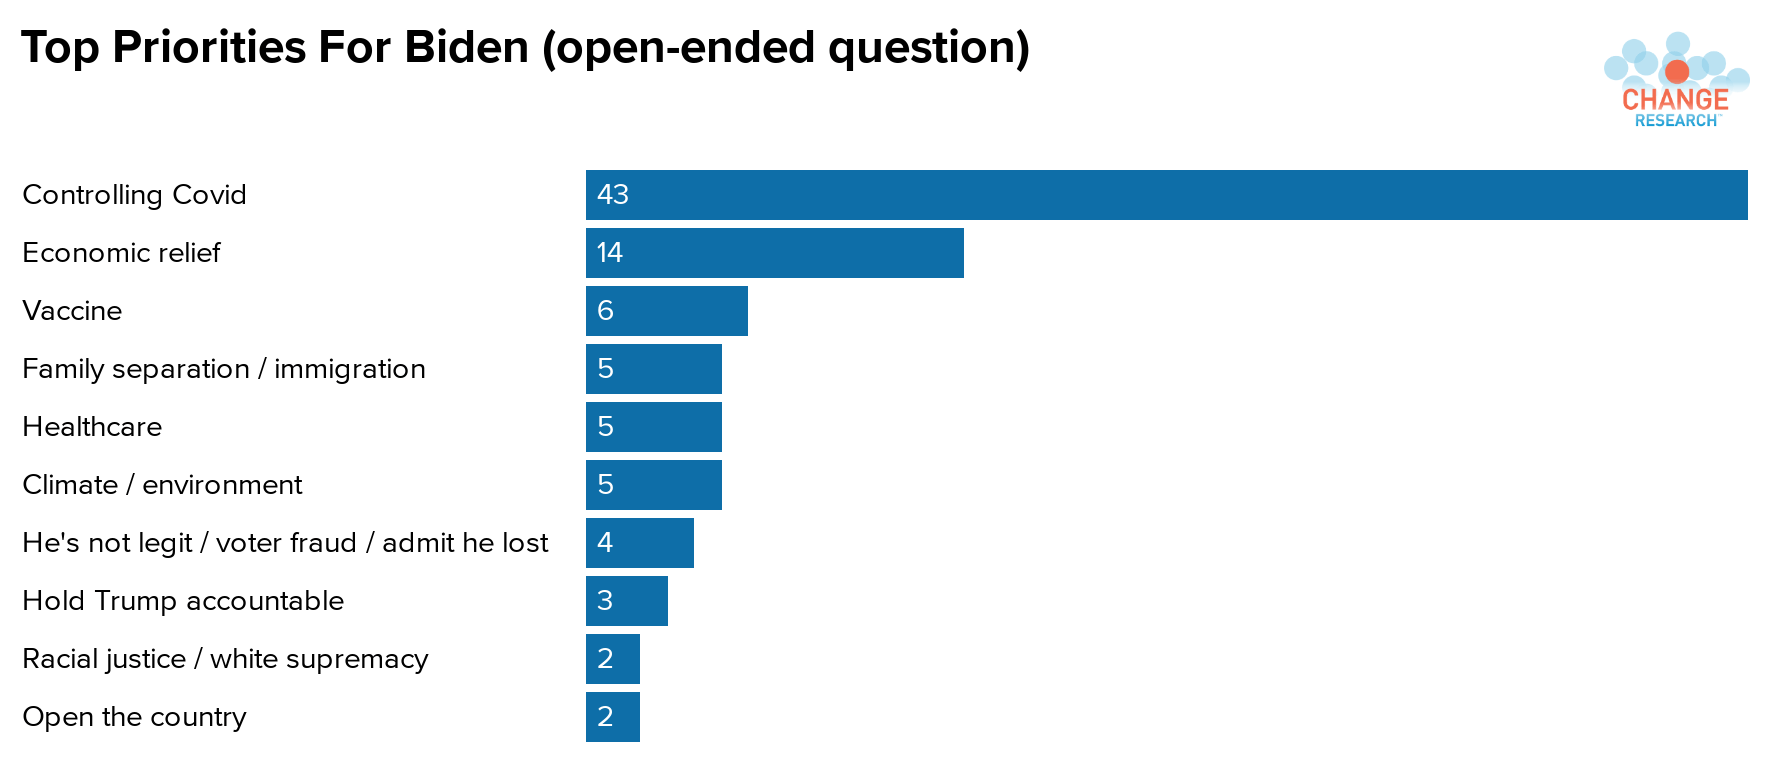
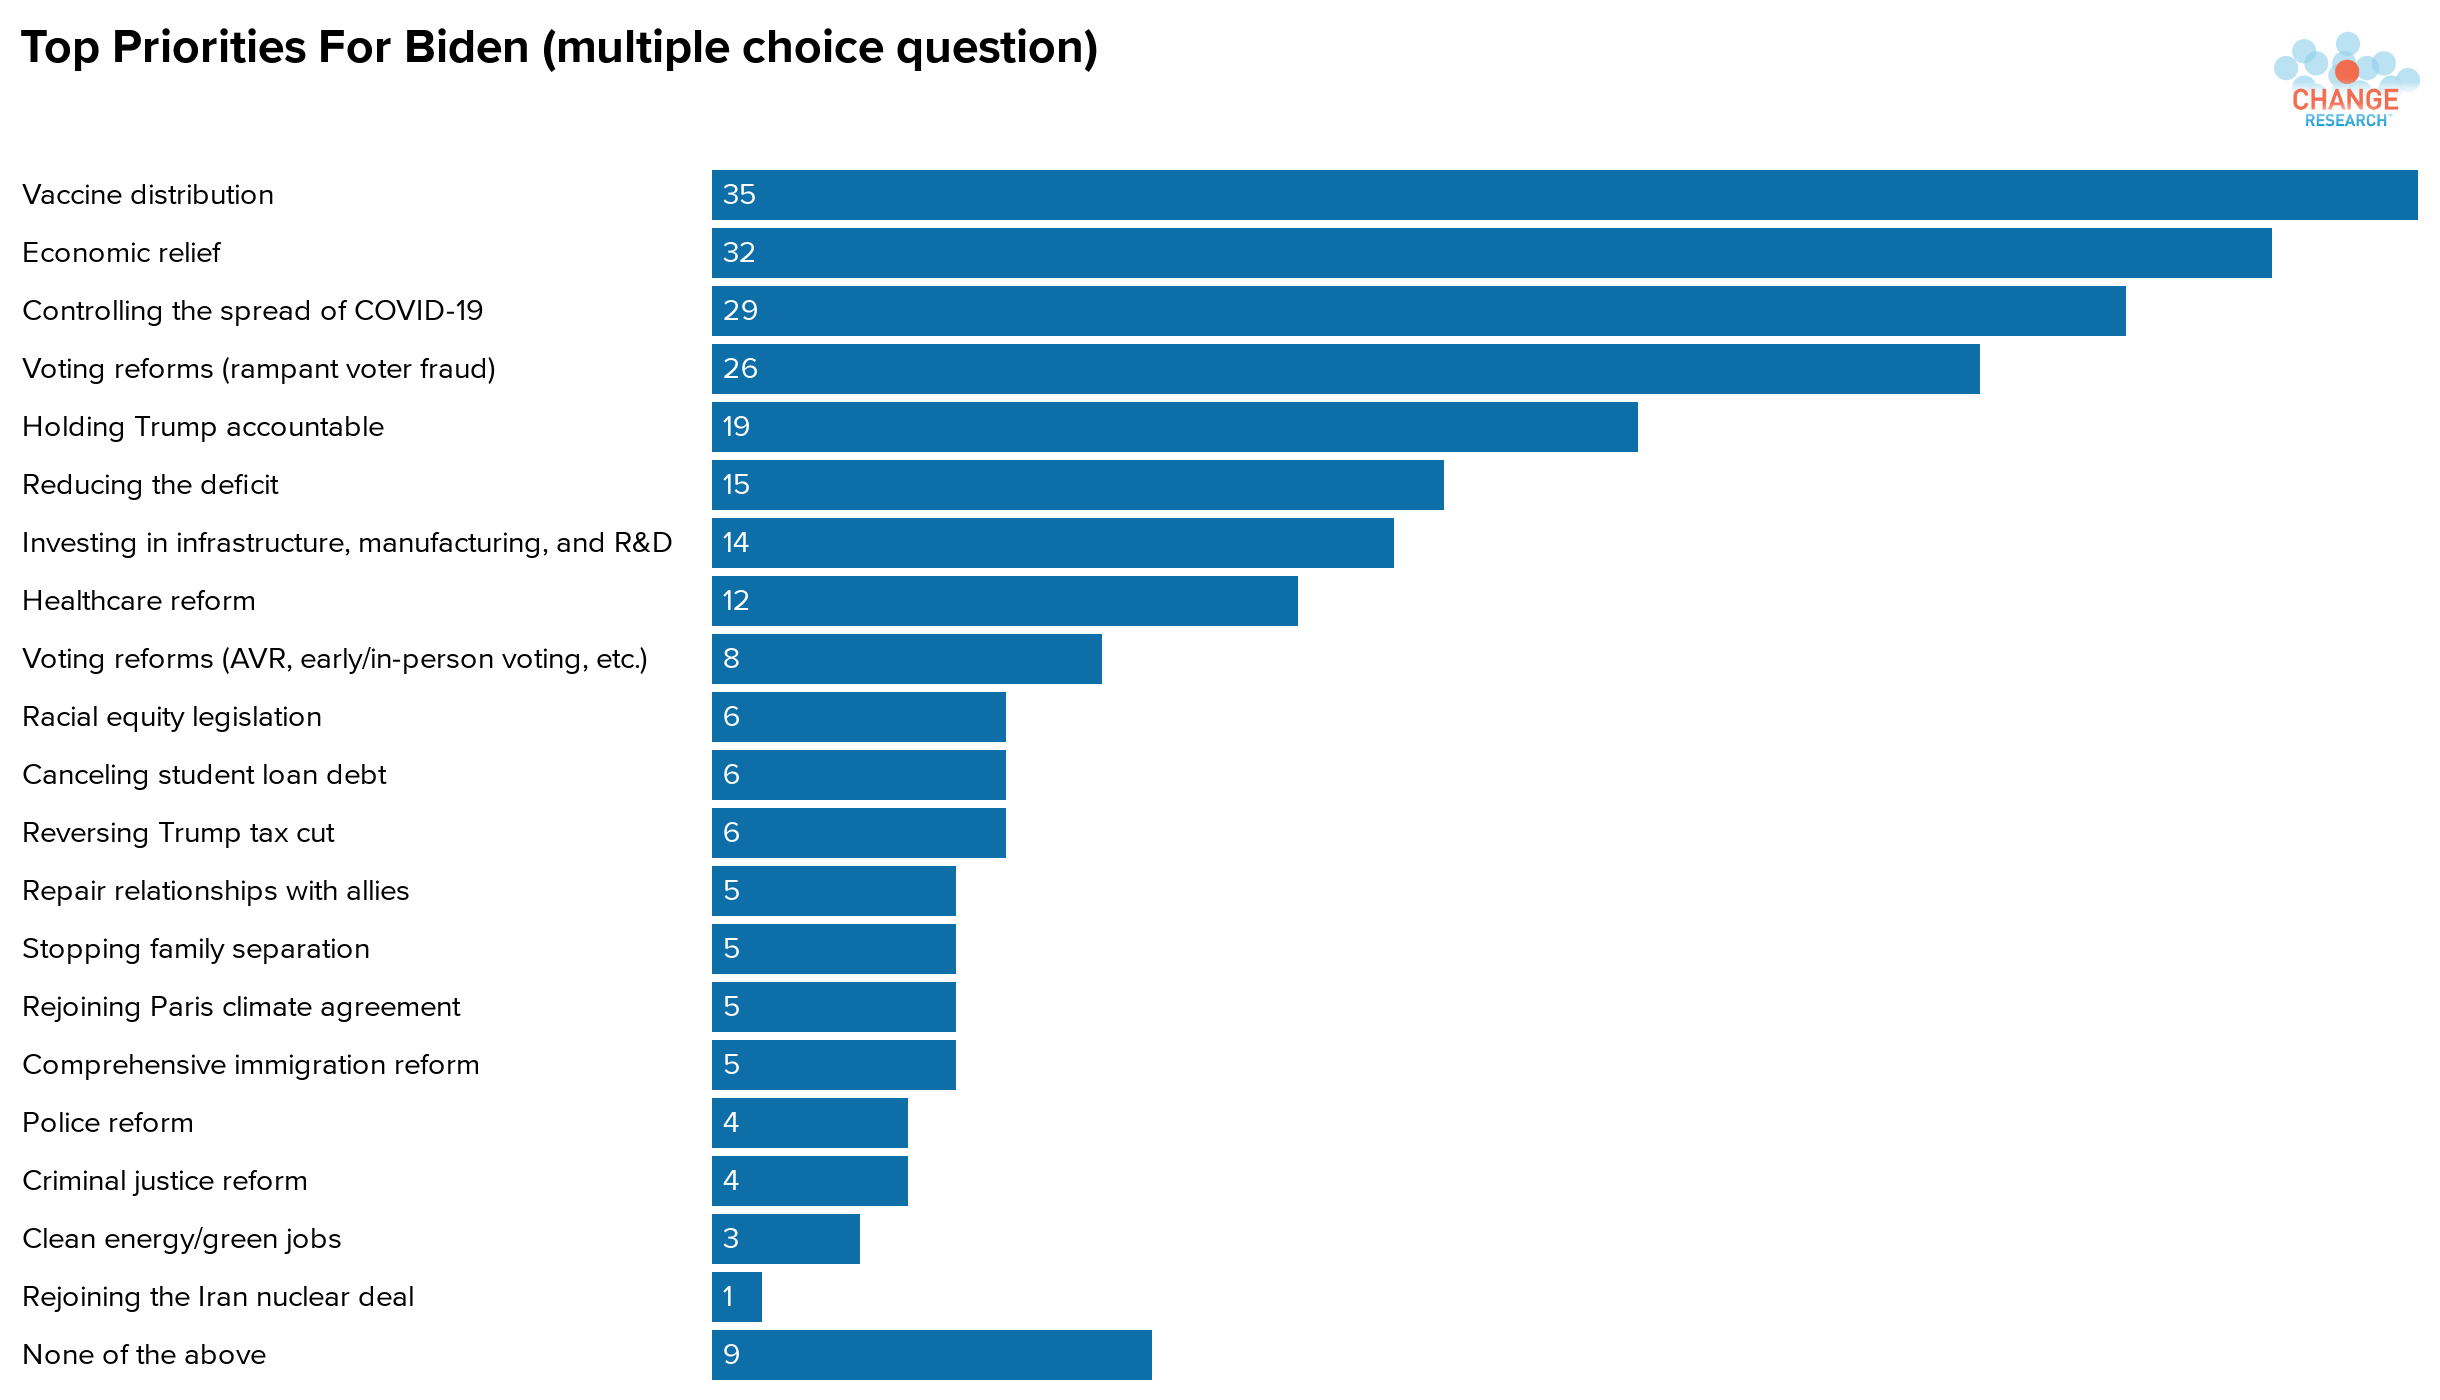
COVID policies are voters’ top priorities. Respondents were asked twice about their top priorities for the first 100 days of Biden’s administration: first in an open-ended question, then with a list from which they were asked to select three. In both sets of responses, COVID policies — including those that curb the spread of the virus and accelerate vaccine distribution, as well as economic relief measures — emerged as voters’ clear top priorities.
But the open-ended responses told a very different story than the multiple-choice responses. While addressing the public health challenge of COVID dwarfed every other topic in open-ended responses (it appeared in 43% of responses; economic relief was in 14%, and no other item was in more than 6%), on the multiple choice question, other issues also got high numbers, with holding Trump accountable and dealing with voter fraud appearing just behind COVID-related policies.
(Such discrepancies are common when we ask both open-ended and multiple-choice questions: often in the latter, we’ll see high numbers for highly partisan issues that are not necessarily top of mind for respondents.)
Among Trump voters in particular, the divide between the open-ended and multiple-choice questions was staggering. In the former, though many Trump voters said their top priority for Biden was that he resign, or something similar, Trump voters were actually slightly more likely to say COVID was their top hope for the administration. Yet on the multiple-choice question, 53% of Trump voters said they wanted the administration to prioritize rampant voter fraud, while only 12% wanted them to stop the spread of COVID.
The multiple choice question also provided a helpful reminder to Trump voters of how much they care about the deficit. While just 8 respondents mentioned the deficit or the debt in open-ended responses (not 8% — 8 people total out of 1701), 27% of Trump voters ranked it as a top-three priority for the Biden administration in the multiple-choice question, making it Trump voters’ second-highest priority for Biden, after addressing voter fraud.
Among Biden voters, the top non-COVID priority is holding Trump accountable (34% of Biden voters rank it in their top three). Next are healthcare reform (16%), racial equity legislation (11%), and repealing the Trump tax cuts (11%).
It’s also interesting to note what was not mentioned in open-ended responses. As noted, the debt and deficit was mentioned only eight times. Only one respondent mentioned the Supreme Court as a top priority — and that respondent argued against court packing. Five mentioned the filibuster, and two mentioned DC statehood.
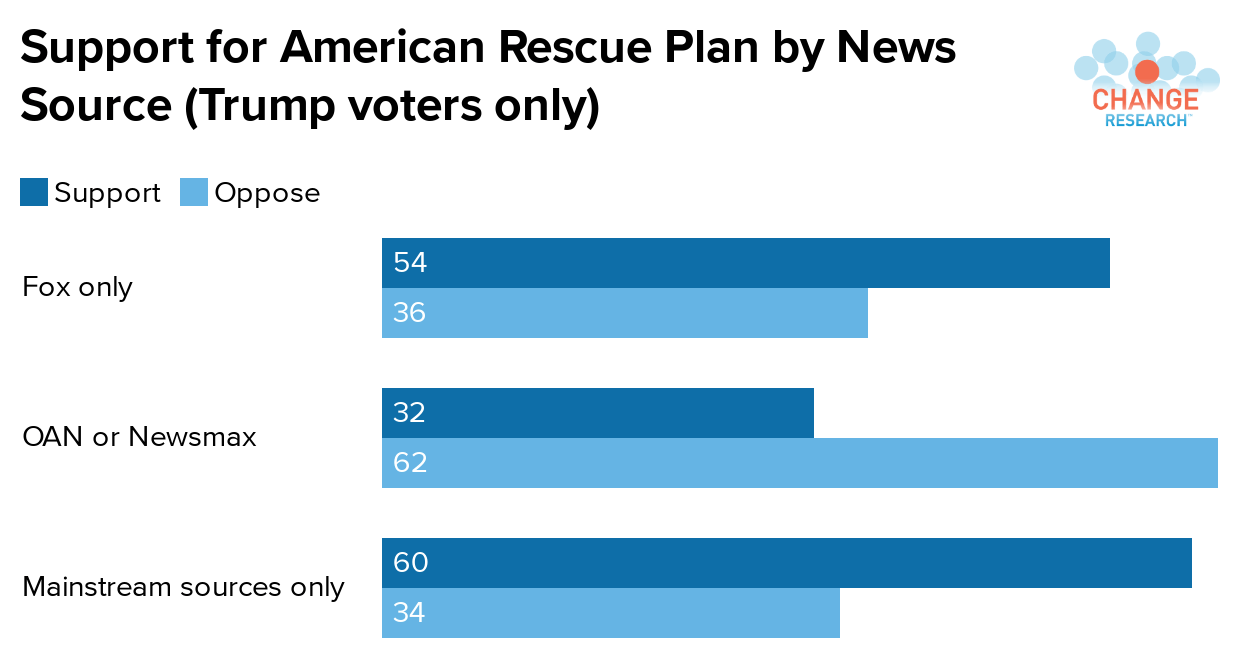
Voters overwhelmingly support the American Rescue Plan. Biden’s $1.9 trillion COVID relief package is supported by 69% and opposed by just 26%. Even 39% of Trump voters support it. That includes 52% of Trump voters in households with incomes under $50,000. As we saw on other policies, there’s a significant divide between working class Trump voters and wealthier ones. 41% of Trump voters making between $50,000 and $100,000, and 30% of those who make over $100,000, support the rescue package.
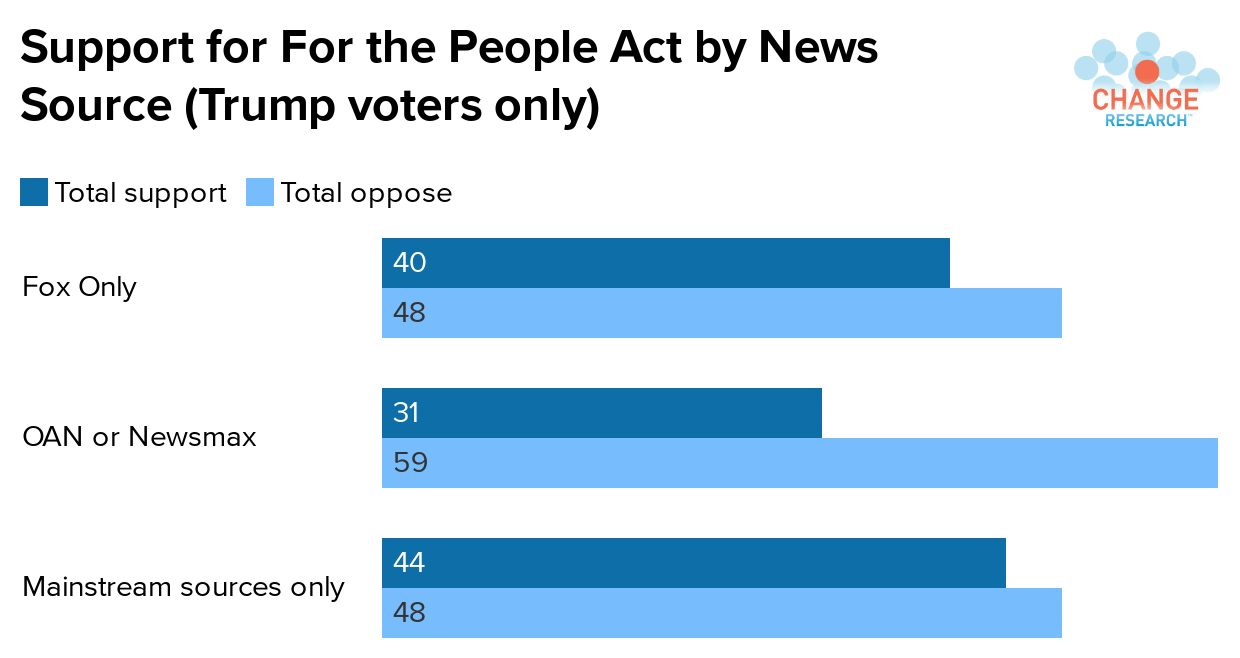
The For The People Act also has near-supermajority support. It’s supported by 65% of voters (including 35% of Trump voters) and opposed by only 27%. Voters overwhelmingly support this bill despite it not being their top priority: when voters were asked what they thought the Biden administration’s top priorities should be, only 8% selected these types of voting reforms (11% of Trump voters and 7% of Biden voters).
Student loan debt forgiveness is supported by a solid majority of voters, at both the $10,000 and $50,000 levels. Voters support $10,000 worth of debt forgiveness by a 55% to 40% margin, and $50,000 of forgiveness by 52% to 43%. Support for $50,000 of forgiveness is higher if the idea of $10,000 of forgiveness is not introduced first: for the half of respondents who saw the $50,000 question first, support for $50,000 was +5 net percentage points higher than for those who saw it second. Even more than with some other policies, support is far higher among less affluent Trump voters: they support student loan forgiveness by over 35 net percentage points more than Trump voters making $100,000 or more. (It’s worth noting that we did not include information about how much this would cost, which could lower support, based on other polling we’ve done.)
Opponents of debt forgiveness stress personal responsibility; a desire not to stick taxpayers with the bill; and a reluctance to let others get benefits they did not get themselves. Not surprisingly, opponents of debt forgiveness were overwhelmingly Republican and independent (6% of those who opposed forgiveness at both levels were Democrats). Answers covered three main areas: 1) people took on loans, and need to pay them back as a matter of personal responsibility; 2) not wanting taxpayers to get stuck with the bill; and 3) those who’ve paid back their own or their children’s loans, and want others to have to do the same. Of those who opposed forgiveness at the $50,000 level but supported it at $10,000, their answers tended to be “$50,000 is too much”; many people said that it was irresponsible to accrue $50,000 in debt in the first place. A smaller number of respondents supported forgiveness at the $50,000 level, but opposed it at the $10,000 level; most of these respondents said that $10,000 was not enough, with some noting that it’s a small fraction of the cost of college tuition.
A narrow majority of voters want the Senate to hold Trump’s impeachment trial, even when confronted with the argument that it will prevent healing. 51% support the Senate holding the trial, while 45% think they should reject it “in order to promote national healing.” Obviously, responses were quite polarized, but notably, more Trump voters want the Senate to hold the trial (7%) than Biden voters who want them to reject it in the name of unity (5%).
Trump voters want Congress to prioritize COVID relief. Biden voters largely want them both to legislate and to hold Trump accountable. 69% of Trump voters want Congress to focus on legislation, while most other Trump voters (24%) aren’t sure. Among Biden voters, 66% want them to do both at once; 20% of Biden voters want them to focus on legislating, and 13% of Biden voters want them to focus on holding Trump accountable. Among all voters, legislating beats out doing both simultaneously, by a 42% to 36% margin.
Should Democrats prioritize a stronger relief package or bipartisanship? It depends entirely on how you word it. Half of respondents were asked about whether Democrats should pass a bill with “all of their priorities,” while half were instead asked about a bill that “provides as much relief as possible.” The alternatives were winning support from both parties “even if Democrats have to compromise on some of their priorities” or “even if it means providing less relief to Americans.”
The results were completely different on each version. Voters prefer a package that “provides more relief” to one with Republican votes by a 46% to 38% margin. But they’d rather have Democrats compromise on their priorities than get all of their priorities by a 64% to 27% margin.
Obstruction from Mitch McConnell will anger twice as many people as it will please. If McConnell and Republicans block Democrats from passing any laws regardless of what those laws do, it will make 58% feel negatively (32% angry, 22% frustrated, 4% sad) and just 29% feel positively (12% happy, 11% relieved, 5% excited). Even among Trump voters, 24% would feel negative feelings and 52% would feel positive ones. This is consistent with our findings on individual proposals: voters strongly support Democrats’ agenda and want it to pass.
Voters support ending the filibuster, and if Republicans obstruct legislation like raising the minimum wage, they’ll support it even more. Initially, 49% support eliminating the filibuster, while 40% are opposed. This is not as polarized as many issues: 21% of Trump voters support ending it, while 68% want to keep it; among Biden voters, it’s 75% to 17%. If a $15 minimum wage were blocked by a filibuster, support would grow to 53%, while opposition would stay steady at 40%. The increase occurs because support increases significantly among Biden voters (who go from initially favoring nuking the filibuster by 75-17 to supporting it 84-9) while it only slightly decreases among Trump voters (from 21-68 to 20-75). Needless to say, support for ending the filibuster has some room to grow, but with 20% support from Trump voters, it also has room to fall — Democrats need to be wise about how they play their hand.
Raising the minimum wage to $15 itself has the support of a solid majority of voters. 55% of voters want to raise it, while 42% are opposed. 90% of Biden voters are joined by 17% of Trump voters in support. Trump voters are again divided along socioeconomic lines on the issue: among Trump voters with household incomes under $50,000, 29% support a $15 minimum wage, while only 12% of Trump voters earning $100,000 or more support it and 16% of Trump voters earning between $50,000 and $100,000 do. There’s no such divide among Biden voters: support is 89% among Biden voters in every income group.
WHAT OAN, NEWSMAX, & FOX ARE DOING TO VOTERS’ MINDS
Only 56% of voters believe Biden won the popular vote. Just 9% of Trump voters acknowledge Biden won more votes; 91% think Trump did. News sources are a major driver of belief in this falsehood. Just 3% of those who watch OAN or Newsmax acknowledge that Biden won the popular vote. 17% of those who watch Fox News but do not watch OAN or Newsmax say he won more votes, and 25% of those who consume at least one mainstream source, but do not watch Fox, OAN, or Newsmax say he did. (“Mainstream” here excludes those who named sources like radio or online news sites, since those can obviously include fringe sources.)
Support for Biden’s policies also varies widely by news source. This can be seen in the charts below:


QAnon is significantly more popular with people who watch OAN or Newsmax than those who don’t, but most Trump voters haven’t heard of it, and those who have are largely negative. Overall, in the open-ended question asking respondents to describe QAnon, 54% of Trump voters said they didn’t know (significantly higher than the 31% of all respondents who didn’t know). 6% of Trump voters view it positively. In a multiple-choice question, 11% of Trump voters say they view it favorably. But 14% of Newsmax/OAN-viewing Trump voters are favorable toward it — twice the number among other Trump voters. Troublingly, many responses among Trump voters were neutral or expressed mixed feelings about it. Broadly, voters see it as a set of wild conspiracy theories, with many seeing it as a cult.
Pence’s favorability has plummeted with Republicans in the wake of January 6. In the Change Research/Crooked Media national pre-election poll, Mike Pence was viewed favorably by 90% of Republicans and Republican-leaning independents and unfavorably by 5%. Now, those numbers are 54% favorable, 27% unfavorable. His numbers have actually improved a bit with Democrats and leaners, from 4% favorable, 93% unfavorable to 10% favorable, 76% unfavorable, with the “very unfavorable” number dropping from 84% of Democrats and leaners to 50%. By comparison, Trump’s numbers have shifted a few points since before the election, but nothing nearly as drastic as Pence’s — clearly, there has been a seismic shift among Republican voters, and it signals real danger going forward.


