As tax season arrives in America, a new national poll from Change Research reveals widespread negative sentiment. Voters are pessimistic about the economy and frustrated by the cost of living. They’re starting to file their tax returns with a mix of annoyance, stress, and dread. Compounding this, significant recent tax policy changes, such as “no tax on tips and overtime,” are shrouded in confusion, with most Americans uncertain about the personal impact of these reforms.
The survey of 1,741 voters, conducted from February 5-18, 2026, portrays a nation grappling with economic unease, polarized along political lines regarding accountability, and primarily planning to use any tax refund for essential survival rather than discretionary spending.
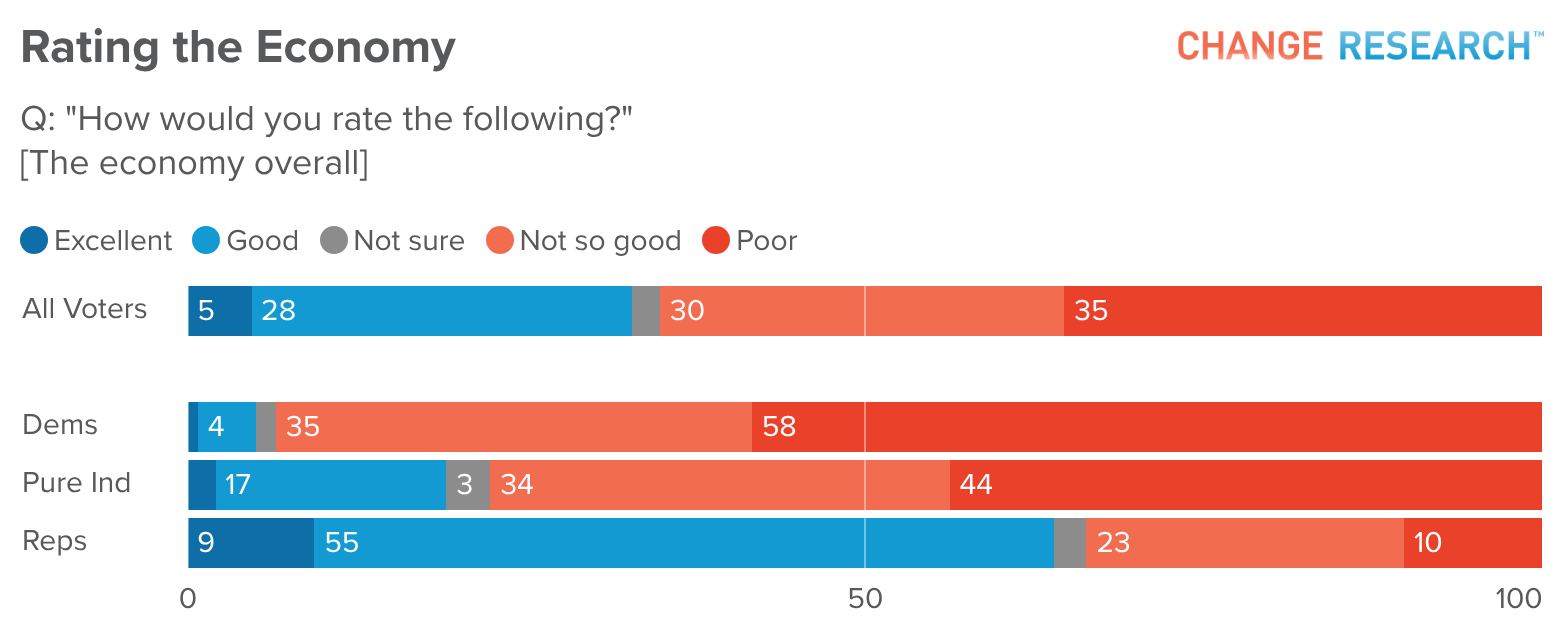
The Economy: Still Not Working for Most People
The economic mood among American voters remains firmly negative. Just 33% rate the economy as excellent or good, while nearly two-thirds (65%) say it’s not so good or poor.
The partisan divide is enormous. 64% of Republicans rate the economy positively, compared to just 5% of Democrats and 19% of independents. But the negativity isn’t limited to partisanship. Among younger voters (18-34), 74% rate the economy as poor, the highest of any age group. Eighty-five percent of Black voters are negative about the economy, and non-college educated voters sit at 70%.
When asked whether the economy is getting better or worse compared to a year ago, 55% say worse, versus 38% who say better. Partisan lenses shape perception here: 75% of Republicans say the economy is improving, while 92% of Democrats say it’s declining.
Perhaps most notable: 46% of voters believe the U.S. is currently in a recession (contrary to the economic definition), compared to 42% who say it’s not. Sixty-nine percent of Democrats and 55% of independents believe the U.S. is in a recession, versus just 21% of Republicans. The perception gap is significant, even if the technical indicators don’t align with much of the public opinion.
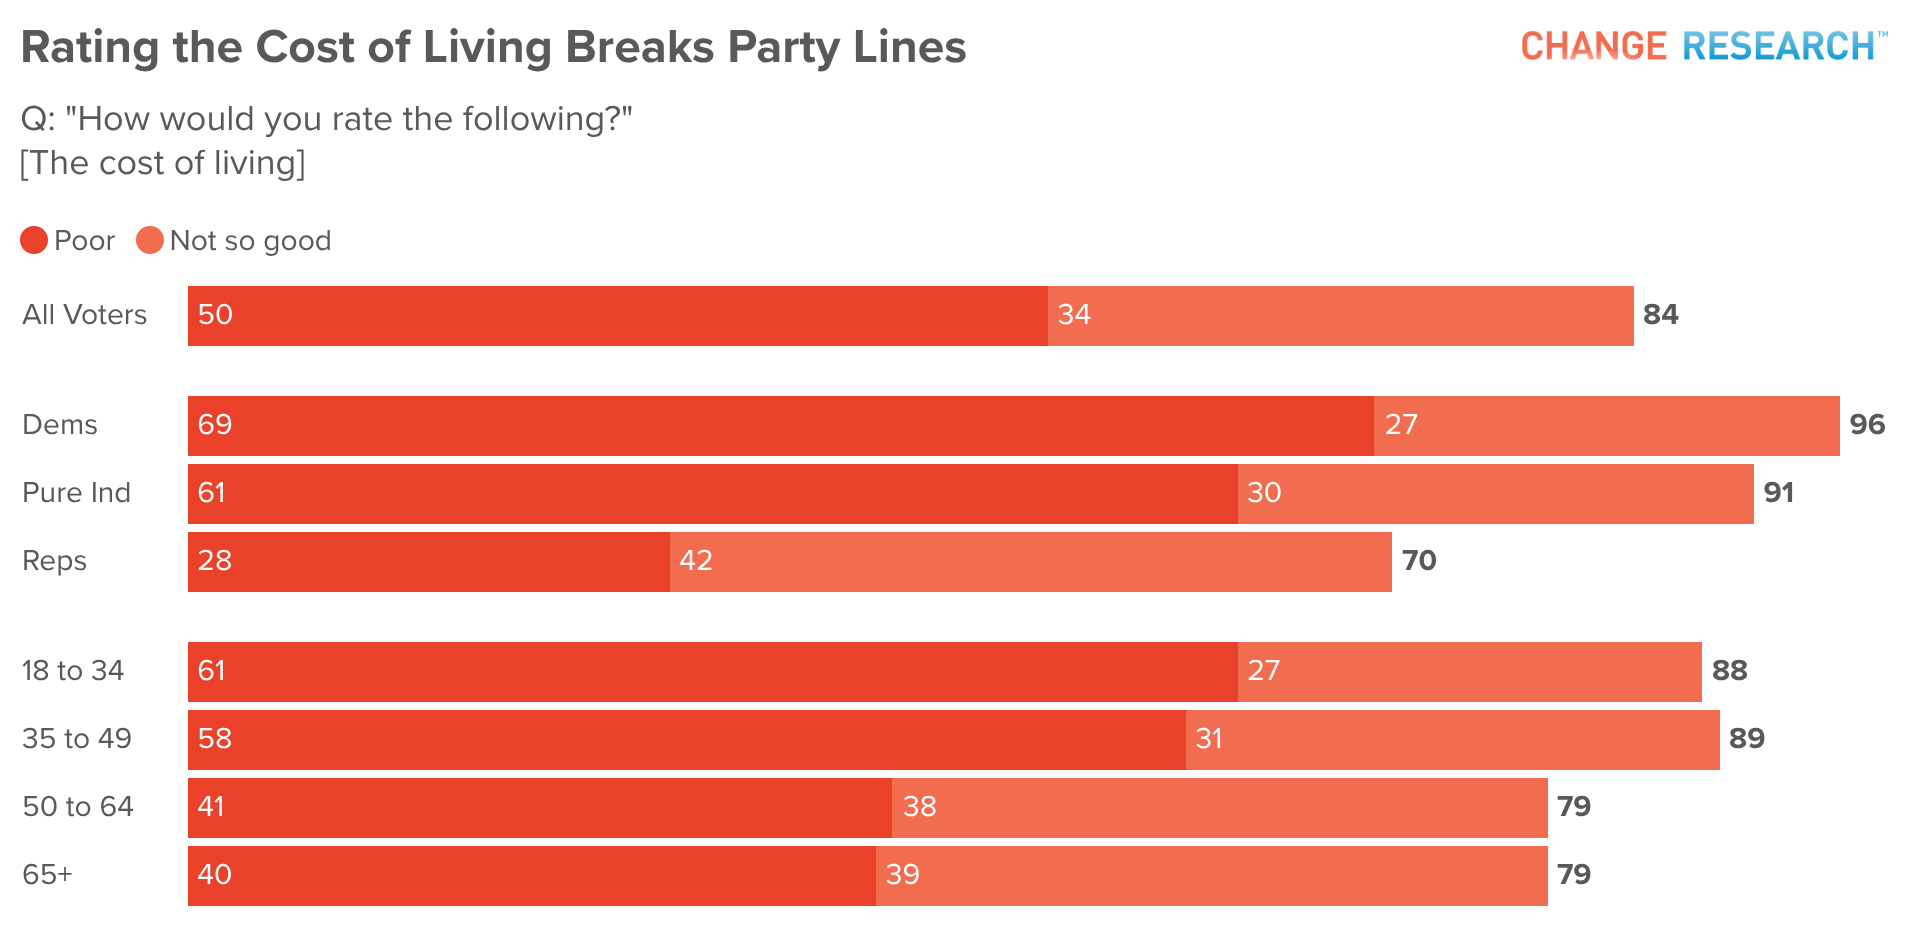
Inflation and the Cost of Living: The Issue That Won’t Let Go
If there’s one aspect of the economy Americans agree on across party lines, it’s that the cost of living is brutal. Eighty-four percent of voters rate the cost of living as poor or not so good, making it the worst-rated economic indicator in the survey. Just 15% say it’s excellent or good.
Republicans, who tend to view the broader economy more favorably, rate the cost of living negatively: 70% say it’s poor or not so good. Among Democrats, 96% rate the cost of living negatively. Among independents, 91%. Younger voters (18-34) and those aged 35-49 are particularly negative on the cost of living at 88% and 89% respectively, suggesting that high costs hitting working-age Americans the hardest.
Inflation is similarly concerning: 76% rate the level of inflation as poor, with just 21% saying it’s excellent or good. The official Consumer Price Index showed inflation easing to 2.4% annually as of January 2026, but voters are still feeling the accumulated weight of price increases from the past several years. For most people, this isn’t about the short-term rate of change. It’s about the fact that groceries, rent, and insurance cost what they cost, and none of that has come back down.
There is one bright spot: 59% rate their personal financial situation as excellent or good. But there is a range across demographics. Among voters under 35, 50% rate their financial situation as positive. Among those making under $50k, only 31% say their finances are in good shape. And Black voters are more negative, with 57% saying their finances are poor or not so good compared to 40% who say they’re doing well.
Tax Season: A Mood of Annoyance and Anxiety
When voters are asked what emotions come closest to describing how they feel about filing taxes this year, the top responses are: annoyed (32%), frustrated (25%), stressed (23%), indifferent (20%), and anxious (20%). Barely anyone is feeling hopeful (13%) or relieved (6%).

Younger voters (18-34) are significantly more likely to report stress and feeling overwhelmed compared to older Americans. Voters aged 35-49 lead on frustration. Those over 65 are the most likely to say they feel indifferent, or that none of these emotions apply to them. In short: on average, the younger you are, the worse tax season feels.
When asked what makes filing taxes hard, the top answers cluster around three themes: worrying about money (21%), the sense that the system feels unfair (20%), and that the rules are too complicated (18%). Fear of making a mistake also ranks high at 13%.
Refunds and Realities: Survival Over Splurging
About 36% of voters expect to get a tax refund this year, while 19% expect to owe money and 15% expect to break even.
The top three uses: put it in savings (29%), pay down debt (24%), and catch up on bills (21%). Just 3% plan to spend it on something fun. The tax refund, for most Americans, is not a windfall. It’s a lifeline.
Among those who expect to owe money, the news is more sobering. 51% say it will be difficult to pay, including 24% who say it will be very difficult. The burden falls unevenly: 77% of Black voters who owe money say it will be difficult, and voters under 35 who owe are significantly more likely to say it will be very difficult (33%) than older cohorts. Lower-income voters and non-college educated voters also report greater difficulty.
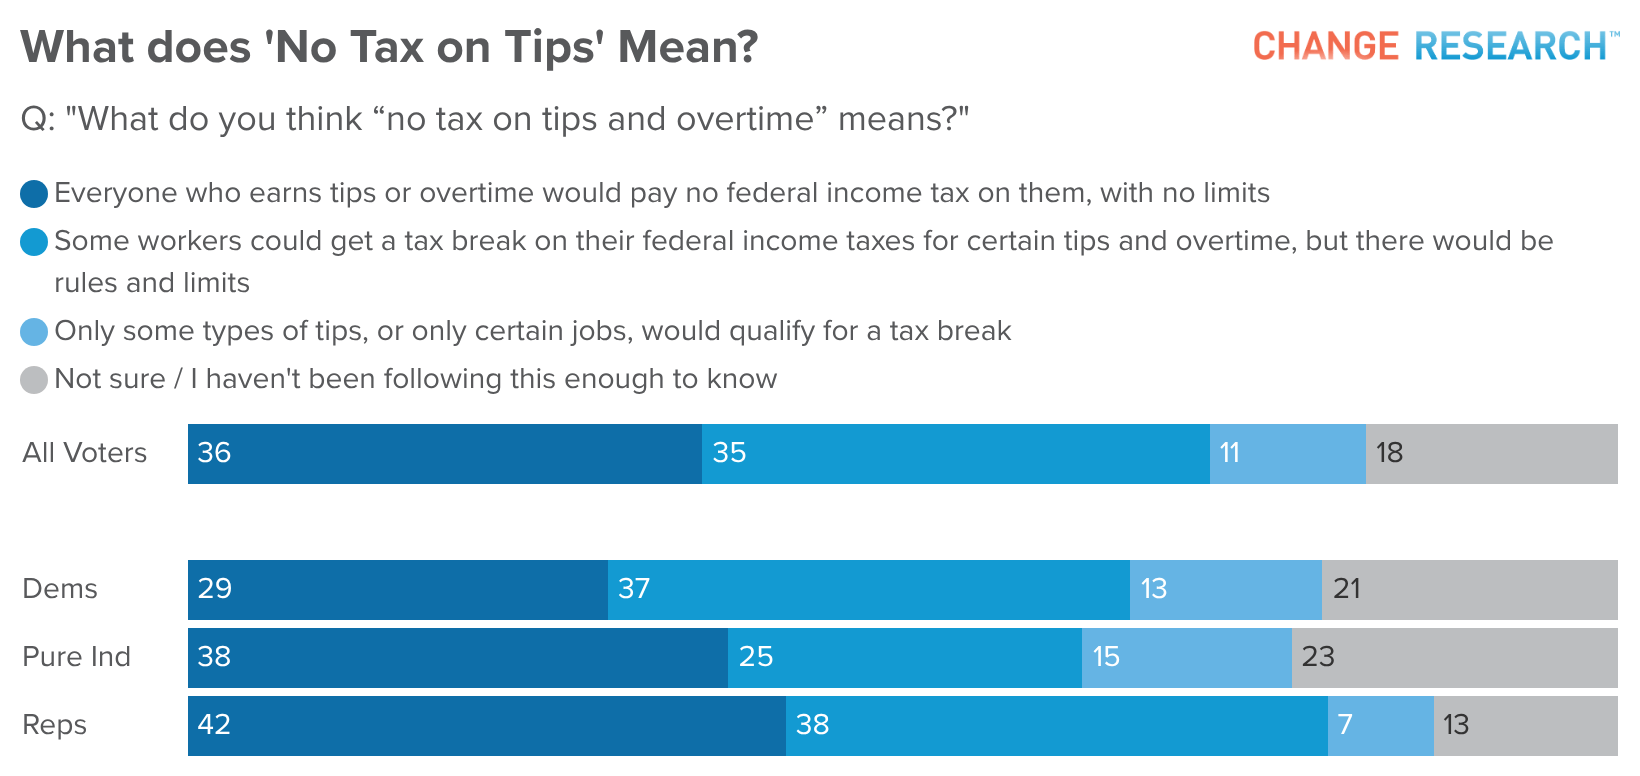
“No Tax on Tips”: Popular Slogan, Widespread Confusion
The One Big Beautiful Bill Act, passed in 2025, introduced a tax deduction of up to $25,000 for qualifying tipped income, one of the most talked-about provisions of the 2025 tax overhaul. But when voters are asked what “no tax on tips and overtime” actually means, the results reveal significant confusion.
Thirty-six percent believe the policy means everyone who earns tips or overtime pays no federal income tax on that income, with no limits. Another third, 35%, correctly understand that the tax break comes with rules and limits. Another 11% think only certain types of tips or jobs qualify, and 18% say they haven’t followed the issue closely enough to know.
In reality, the deduction is capped at $25,000, phases out for taxpayers earning more than $150,000 ($300,000 for joint filers), applies only to certain qualifying occupations, and still leaves workers on the hook for Social Security and Medicare taxes. The gap between the slogan and the substance is wide, and it suggests that a large share of Americans filing their taxes this spring may be in for a surprise, whether positive or disappointing, when they see what the deduction actually delivers.
The confusion doesn’t break neatly along party lines. Republicans are slightly more likely to believe the policy is universal and unlimited (42%) compared to Democrats (29%), but misunderstanding is widespread across every demographic group. Younger voters and those without a college degree are more likely to say they haven’t followed it closely.
Trump Accounts: Interest is High, But So Are the Question Marks
Another provision of the One Big Beautiful Bill creates “Trump Accounts,” government-funded savings and investment accounts for eligible children that start with a $1,000 deposit. When asked whether they’d open one for an eligible child, 54% of voters say they’d be likely to do so, including 39% who say they’d be very likely. Just 22% say they’d be unlikely.
The partisan gap is massive. 83% of Republicans say they’d likely open one, compared to just 27% of Democrats. Among independents, 43% say they’d be likely to open an account.
Trump and the Economy: Underwater on Every Metric
President Trump’s overall job approval stands at 43% approve versus 55% disapprove. But his economic approval numbers are worse than his overall approval numbers. On the economy broadly, just 41% approve of his handling, while 55% disapprove. On tariffs, 39% approve while 55% disapprove. And on inflation and the cost of living, the issue voters say matters most to them, only 37% approve, while 59% disapprove.
Trump’s approval on inflation is particularly striking. Even among independents, just 22% approve of his handling of inflation and the cost of living, versus 69% who disapprove. Among voters under 35, only 27% approve compared to 66% who disapprove. Among Hispanic voters, disapproval of his handling of inflation hits 85%. Among voters making under $50k, 76% disapprove. Many of the demographic groups most squeezed by rising costs are also most critical of Trump’s performance on the issue.
Immigration remains Trump’s strongest issue, with 45% approving versus 52% disapproving. He’s also slightly more popular on his handling of deportations, with 44% approving 54% disapproving. But on every economic indicator polled, more voters disapprove than approve. And its voters say that economic issues are high on their list of important issues.
Top Issues: It’s the Economy (and Corruption)
When asked to pick their top three most important political issues, voters’ priorities reflect the broader mood: government corruption leads at 34%, followed by inflation and the high cost of goods at 28%, immigration and border security at 21%, and the high cost of healthcare at 20%.
Cost-of-living issues make up much of the top of the list. If you combine inflation, healthcare costs, housing costs (16%), and insurance costs (16%), the high cost of everything is the defining issue of this electorate by a wide margin. Government corruption is the top single issue, and ranks as the top issue across both parties: 36% of Democrats and 33% of Republicans cite it. However, voters likely have very different ideas about what that corruption entails.
Housing costs are disproportionately important to younger voters (27% among 18-34) and Hispanic voters (21%), while ensuring election integrity resonates more with older voters (24% among 65+) and Republican voters (22%). Racial equity and justice is the highest-priority issue for Black voters at 34%.
Looking Ahead: Pessimism Holds
When asked whether things will be better or worse a year from now, pessimism wins on every measure we tested. On the U.S. economy: 46% say things will be worse in a year, just 32% say better. On the price of everyday goods: 51% say worse, just 26% say better.
That last number is perhaps the most telling. Half the country expects prices to keep climbing. Consumer sentiment has been hovering near decade lows, and the Federal Reserve is still balancing rate decisions against concern about inflationary pressures.
Methodology
Change Research conducted this survey of 1,741 respondents nationally from February 5-18, 2026. The modeled margin of error is ±2.5 percentage points.
Want access to the full crosstabs and data? Sign up for the Change Research Data Portal here.