A Change Research national survey of 1,541 registered voters, conducted March 8 to 12, 2026, finds that voters express significantly more confidence in their own state’s vote-counting than in the national picture; that proposed citizenship documentation requirements for voter registration would pose meaningful challenges for a notable share of voters; and that fewer than half believe their congressional district was drawn fairly.
In February 2026, the House passed the SAVE America Act, which would require documentary proof of citizenship, such as a passport or birth certificate, to register to vote in federal elections. The bill has not yet passed the Senate. Election security and administration remain active points of national debate heading into the November midterms.
State vs. National Confidence
Voters express more confidence in their own state’s vote-counting than in the broader national picture. Sixty-two percent say they are confident that votes in the November congressional election will be counted accurately in their state, compared to 33% who are not. Nationwide confidence is lower: 46% are confident that votes will be counted accurately across the country, while 49% are not.

The gap between state-level and national confidence holds across party lines, though the underlying numbers diverge sharply. Democrats are more confident about their state’s count (72%) than Republicans are about theirs (54%). At the national level, that split widens further: 57% of Democrats express confidence in the national count, compared to just 36% of Republicans.

Confidence by Geography
When we ask about specific places, confidence tracks closely with which party controls them. Rural communities see the highest confidence of any geography we tested: 64% of voters say they trust those votes will be counted accurately. Republicans drive that number strongly, with 81% expressing confidence in rural vote counts, compared to 56% of Democrats.
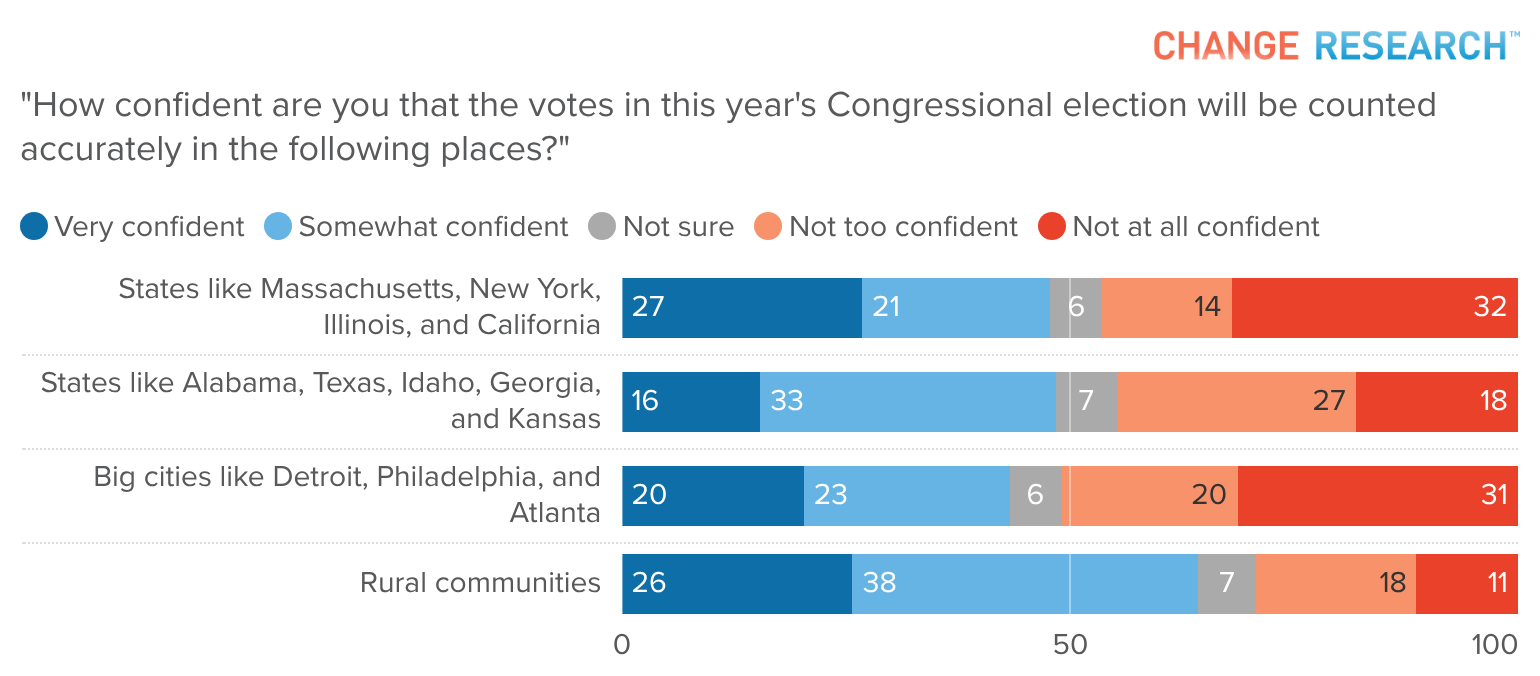
The pattern reverses sharply for urban areas. Overall, 43% of voters are confident about vote counts in big cities like Detroit, Philadelphia, and Atlanta, while 51% are not. Among Democrats, 71% are confident in those cities. Among Republicans, just 14% are.
Red-leaning and blue-leaning states show the same dynamic. For states like Alabama, Texas, Idaho, Georgia, and Kansas, 61% of Republicans express confidence compared to 37% of Democrats. For states like Massachusetts, New York, Illinois, and California, 81% of Democrats are confident compared to 13% of Republicans.
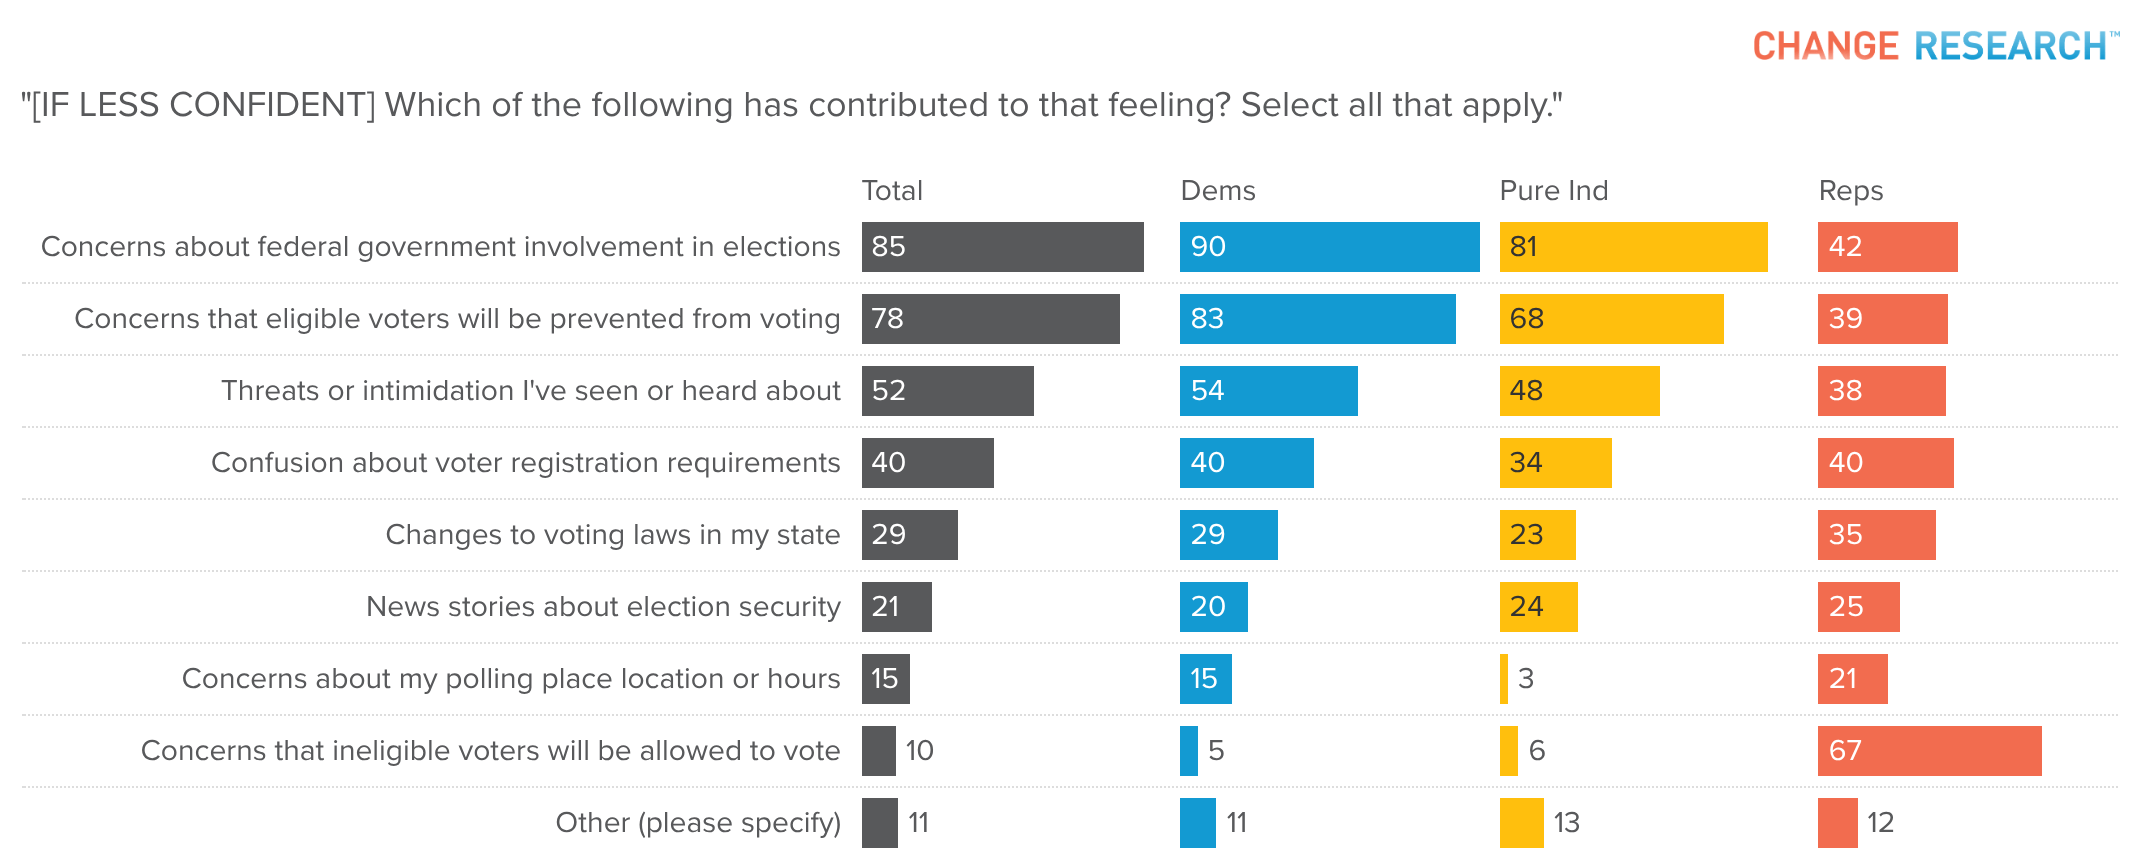
Why Some Feel Less Confident
Among voters who say they feel less confident about their ability to cast a vote compared to previous elections, the concerns are wide-ranging. Eighty-five percent of that group cite concerns about federal government involvement in elections, and 78% cite concerns that eligible voters will be prevented from voting. Fifty-two percent point to threats or intimidation they have seen or heard about, and 40% cite confusion about voter registration requirements. About three in ten cite changes to voting laws in their state.
Why Others Remain Confident
Among voters who feel about as confident or more confident than before, familiarity with the process is the top driver. Forty-eight percent say they know what to expect and feel comfortable with how voting works. Thirty-nine percent say they trust how elections are run in their state, and 28% say they have confidence in their local election officials. About one in five say they have seen efforts to make elections more secure. A similar share say they plan to vote early or by mail to avoid any potential issues.

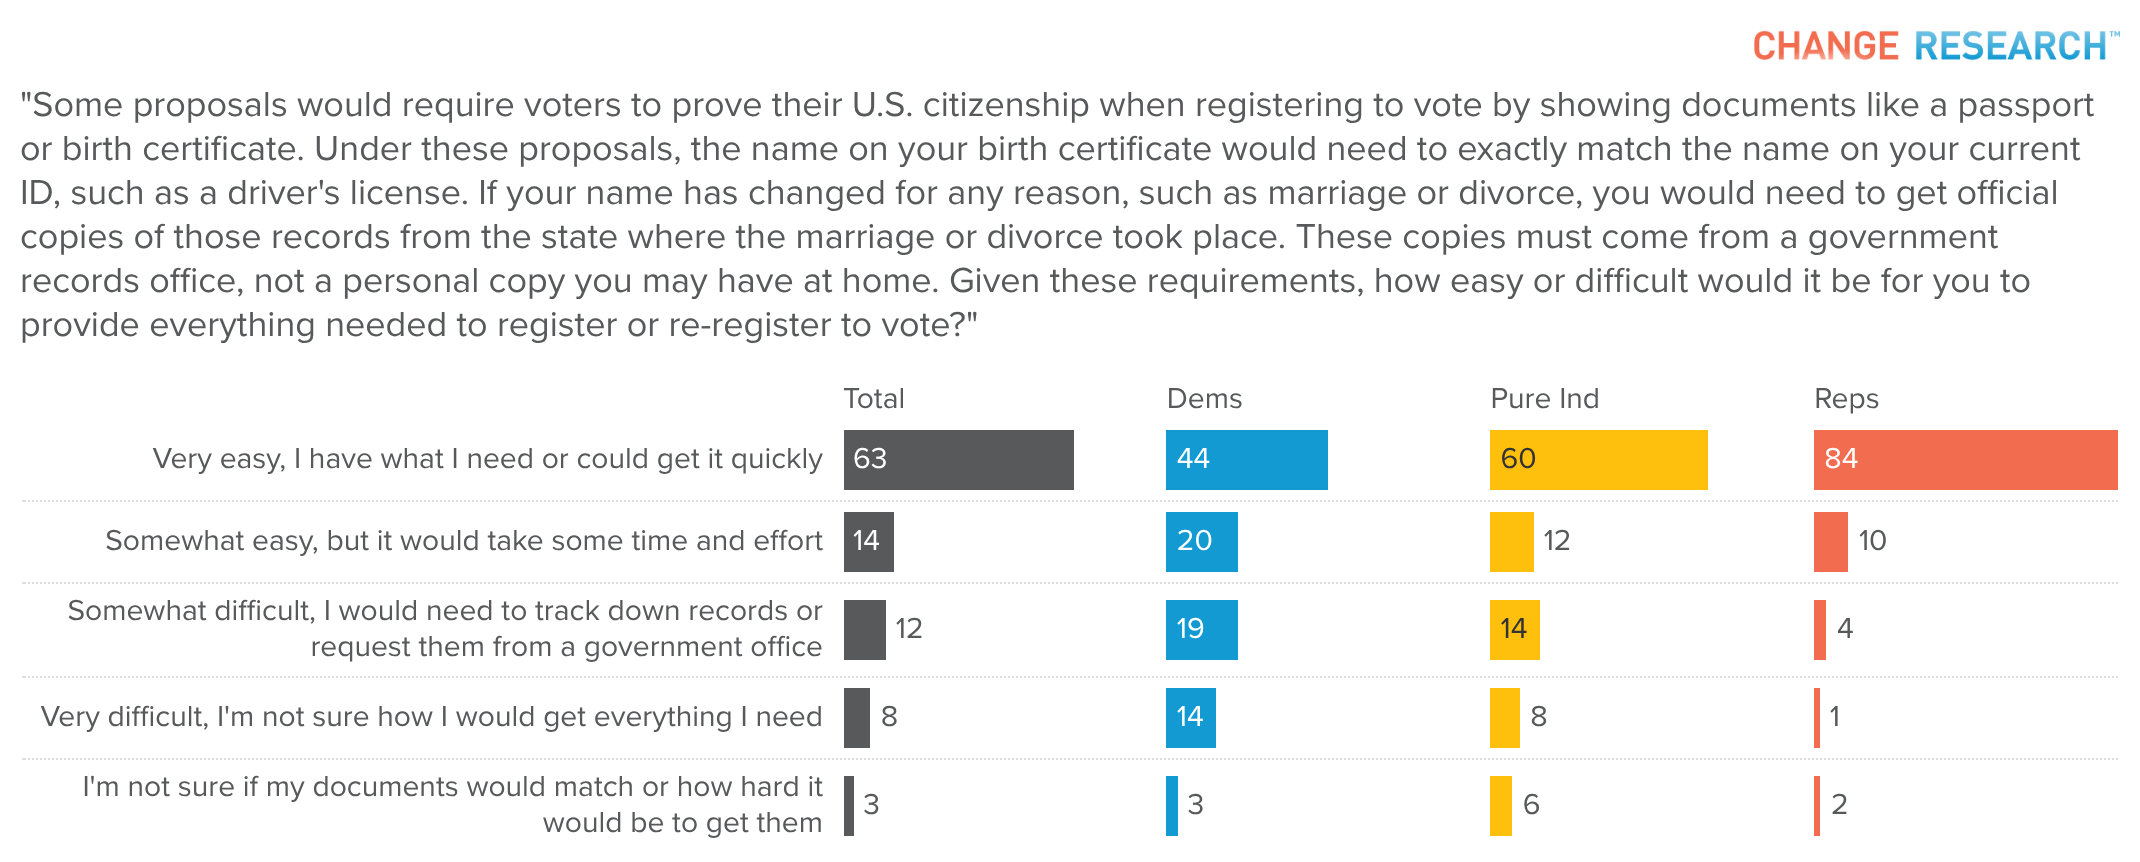
Citizenship Documentation Requirements
We described proposed requirements under which voters would need to provide documents like a passport or birth certificate when registering to vote, with names required to exactly match current ID. Voters whose names have changed would need to obtain official records from the state where that change took place. Given those conditions, 63% of voters say it would be very easy for them to provide what is needed, and 14% say it would be somewhat easy but would take time and effort. A combined 20% say it would be somewhat or very difficult.
The burden falls unevenly across demographic groups. Women are more likely to report difficulty than men: 23% of women say they would face some degree of difficulty with the requirements, compared to 15% of men. Lower-income voters also report more difficulty. Among voters earning under $50,000, 56% say compliance would be very easy, noticeably lower than the 70% among voters earning $150,000 or more. Younger voters are the most likely to report difficulty of any age group, with voters 18 to 34 showing the highest rates of uncertainty about whether they could meet the documentation requirements quickly.
Perceptions of Redistricting
We also asked voters whether they believe the congressional district they currently live in was drawn fairly. Forty-two percent say yes, 26% say no, and 31% are not sure. A majority of voters either question the fairness of their district lines or lack enough information to say.
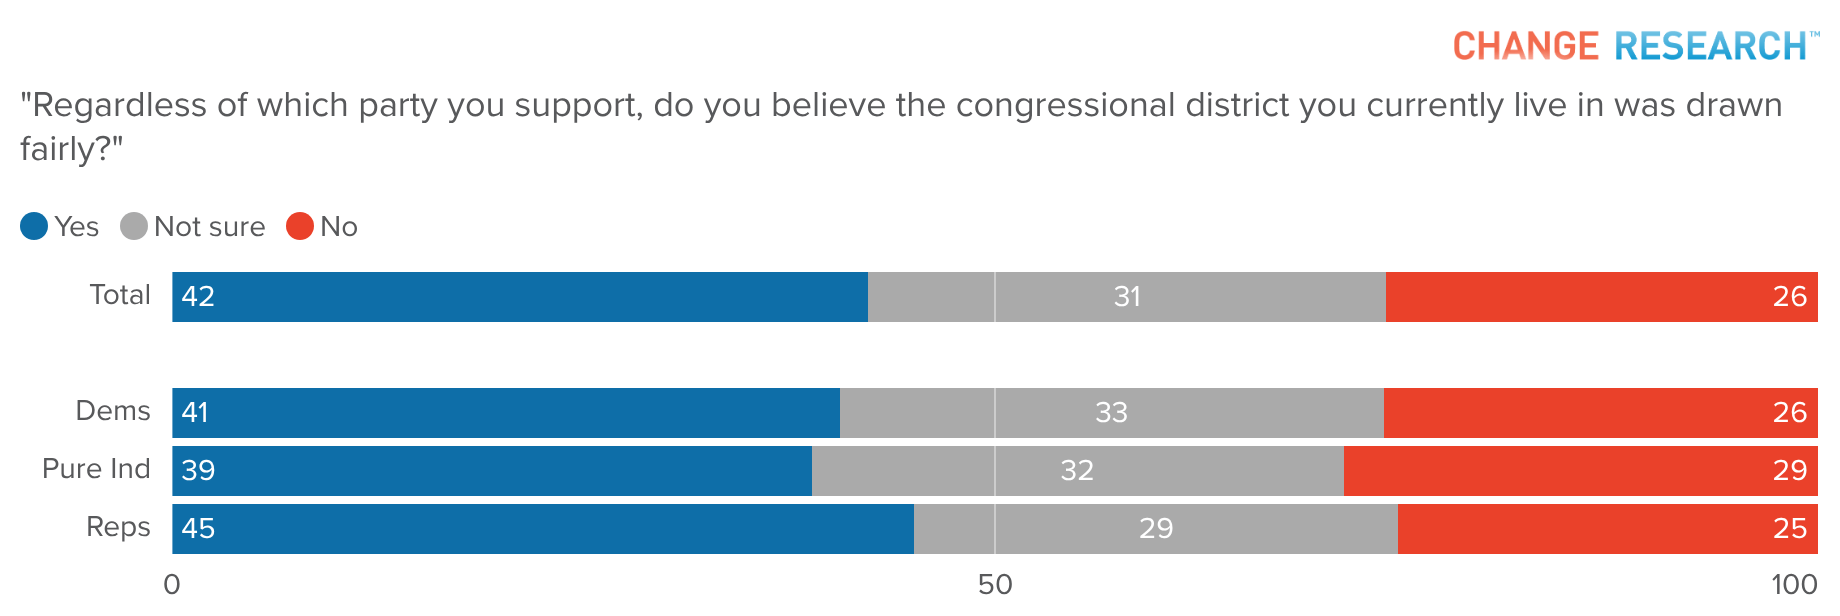
Younger voters are the most skeptical: only 33% of voters aged 18 to 34 believe their district was drawn fairly, compared to 50% of voters 65 and older. Men are more likely than women to say yes, with 47% of men believing their district was drawn fairly, compared to 38% of women. Across party lines, there is notable agreement. Forty-one percent of Democrats, 45% of Republicans, and 39% of independents believe their district lines are fair, suggesting skepticism about redistricting is not confined to one side.
These findings also vary considerably by where voters live. A companion analysis breaks down confidence in vote-counting, redistricting perceptions, and documentation burden by region and community type. Read the regional breakdown here.
Methodology
Change Research surveyed 1,541 registered voters online from March 8 to 12, 2026. The margin of error is +/- 2.6 percentage points. Full crosstabs, including breakouts by party, gender, age, race, and military family status, are available through the Change Research Data Portal.
Want access to the full crosstabs and data? Sign up for the Change Research Data Portal here.