A Change Research national survey of 2,244 registered voters, conducted from May 5-10, 2026, finds that more voters oppose than support the Supreme Court’s recent decision to limit how the Voting Rights Act can be used to challenge congressional district maps. A plurality supports a federal guarantee of proportional racial representation in Congress. And 61% say a Congress composed primarily of members elected from uncompetitive, single-party districts would erode their trust in the institution.
On April 29, 2026, the Supreme Court ruled 6-3 in Louisiana v. Callais that Louisiana’s congressional map, redrawn to create a second majority-Black district, constituted an unconstitutional racial gerrymander. The decision narrows how states can use race as a factor in drawing congressional districts, limiting Section 2 of the Voting Rights Act of 1965. Louisiana has since postponed its congressional primaries. Tennessee and Alabama have moved to revise their legislative districts.
Change Research is tracking this closely as its consequences take shape in communities across the country. This survey was conducted in the immediate aftermath of that ruling, as its real-world consequences were beginning to take shape.
Nearly Half Say Congress Should Reflect the Country’s Racial Makeup
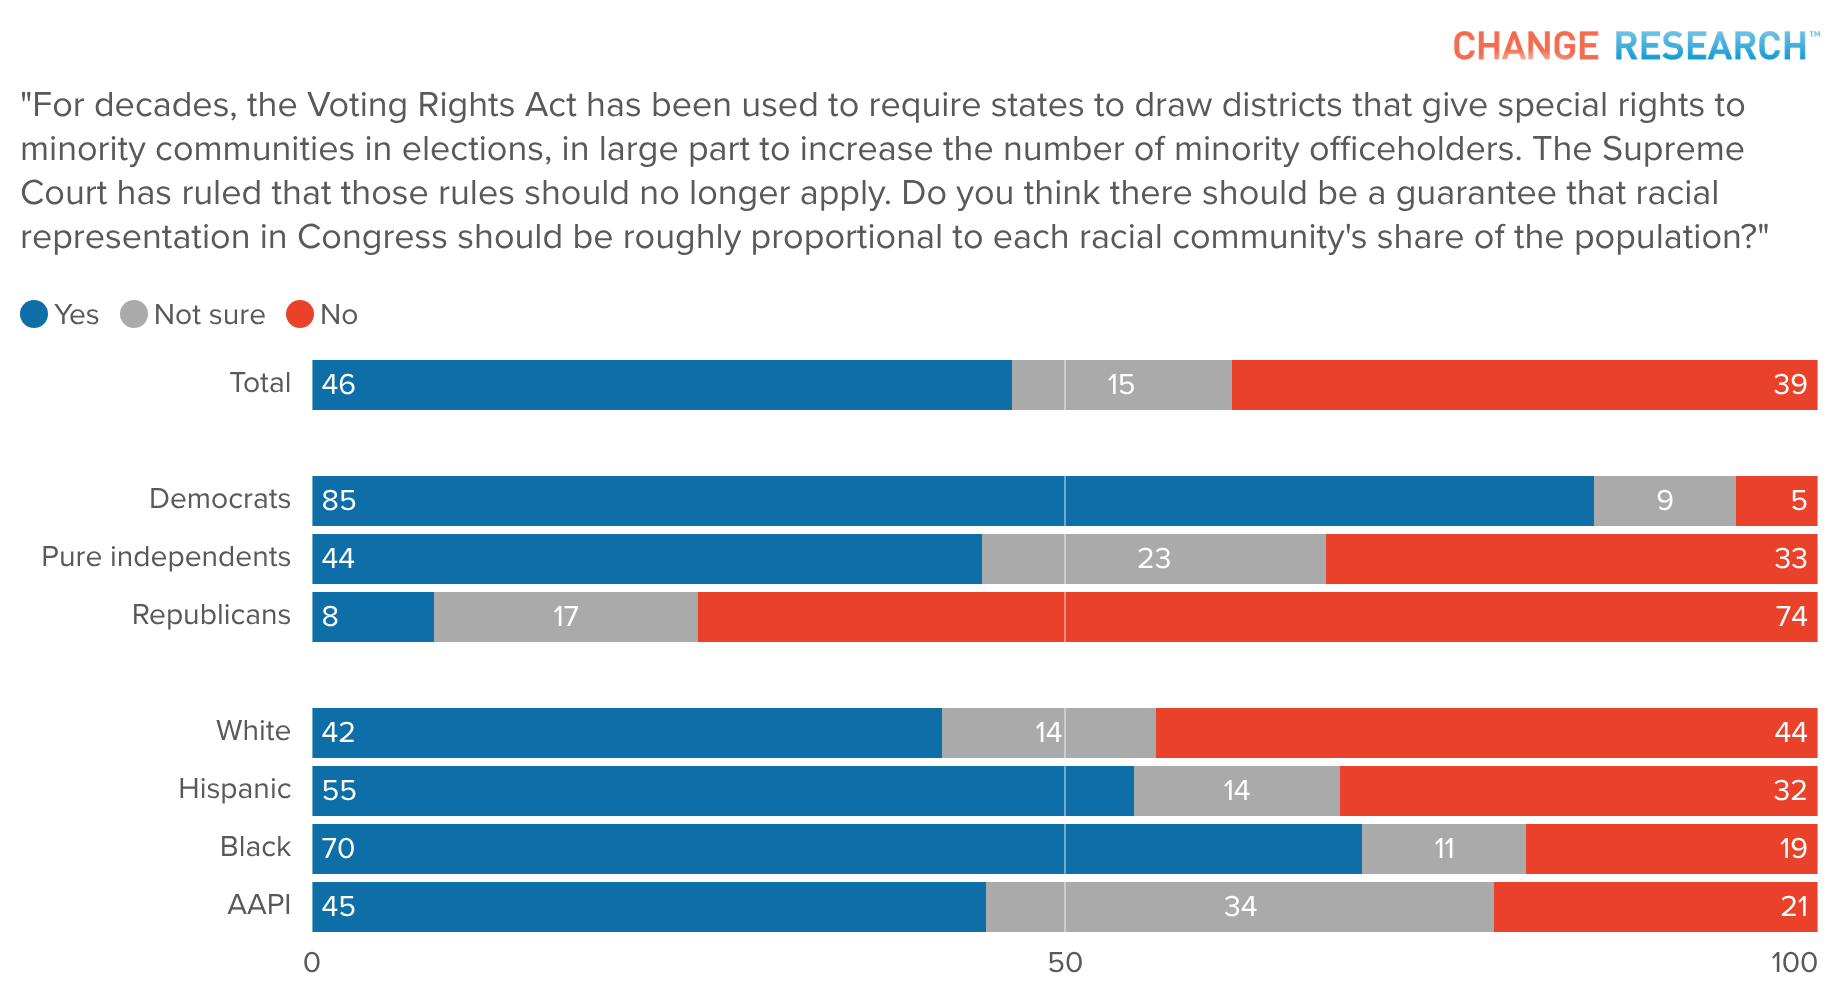
The survey gave voters background around the Voting Rights Act, then asked a direct question: should there be a federal guarantee that the racial makeup of Congress reflects the racial makeup of the country? Forty-six percent said yes, 39% said no, and 15% were not sure.
The demographic breakdown
The partisan divide is the biggest story here. Democrats back a racial representation guarantee 85% to 5%. Republicans oppose it 74% to 8%. That is a 77-point gap. Among independents, feelings are split: 44% yes, 33% no, 23% not sure.
Race shapes the picture too, alongside party:
- Black voters: 70% support, 19% oppose
- Hispanic voters: 55% support, 32% oppose
- AAPI voters: 45% support, 21% oppose, 34% not sure (highest uncertainty of any group)
- White voters: 42% support, 44% oppose (the only group where opposition leads)
Opinion on the Callais Ruling
Voters, given a brief summary of the Supreme Court’s decision in Louisiana v. Callais, oppose it 46% to 36%, with 18% not sure. Thirty-nine percent of voters strongly oppose the ruling, compared to 26% who strongly support it.

A closer look
No racial group in this survey has a majority backing the ruling. Opposition exceeds support across racial groups:
- Black voters: 62% oppose, 22% support. Sixty percent oppose strongly, the highest strong-opposition figure of any demographic in the survey.
- Hispanic voters: 51% oppose, 31% support
- White voters: 43% oppose, 39% support
- AAPI voters: 45% oppose, 31% support
The partisan lines are sharp. Democrats oppose the ruling 83% to 6%. Republicans support it 68% to 8%, but 24% are not sure. Among independents, opposition leads 48% to 28%, with 24% still undecided.
Uncompetitive Districts and Congressional Trust
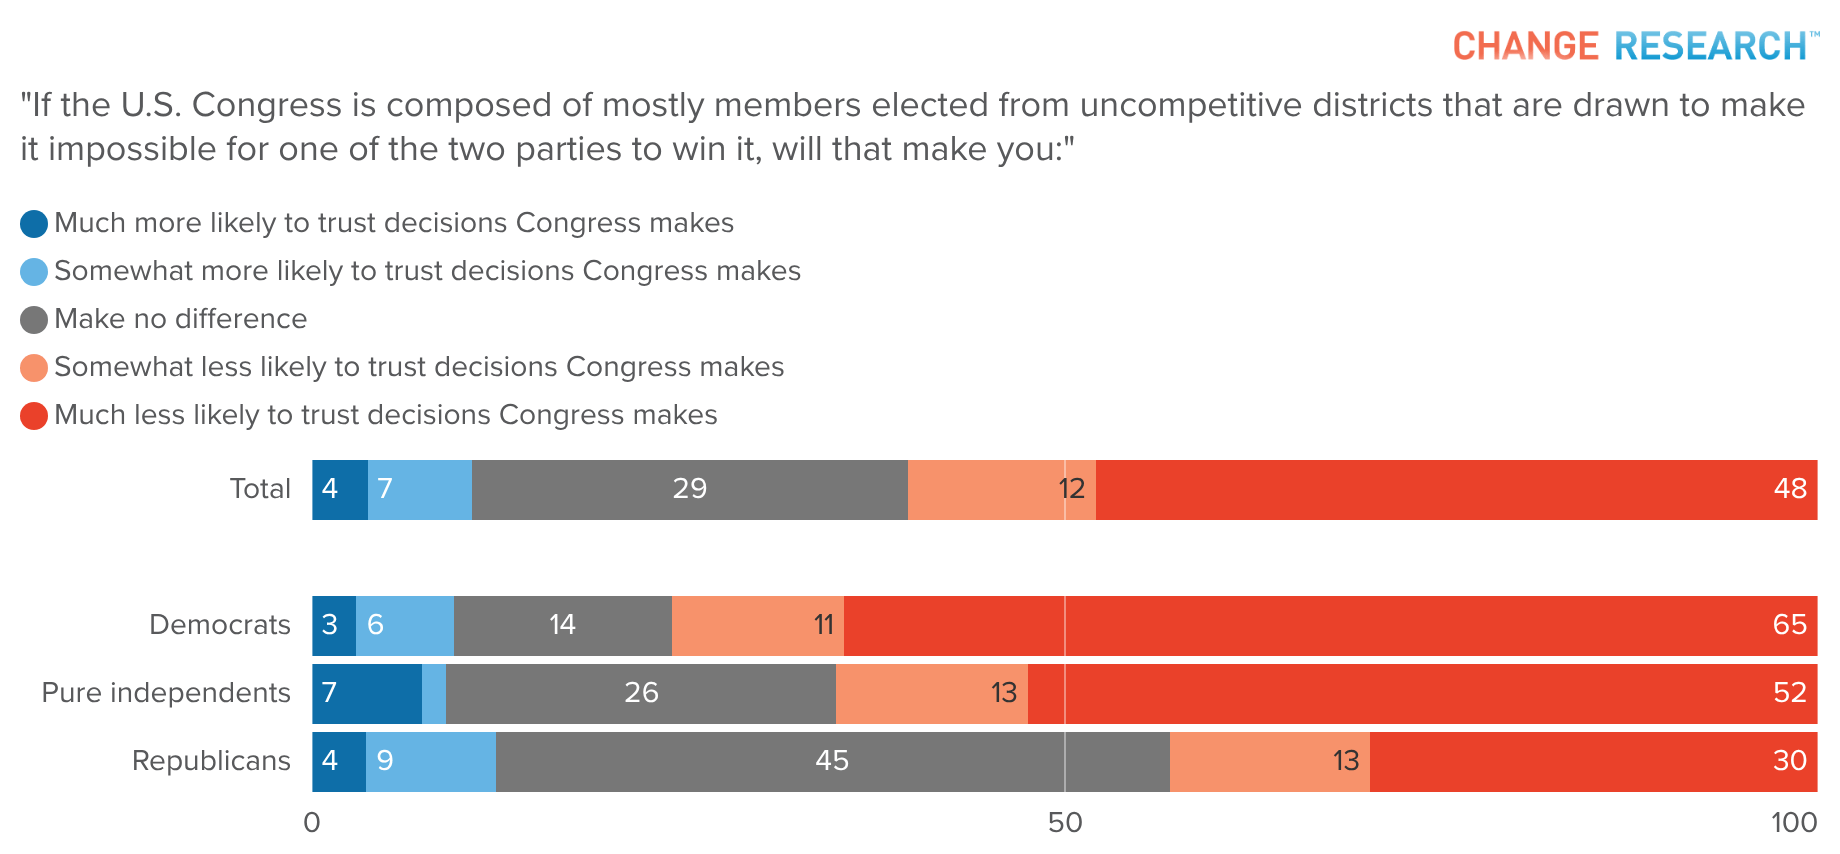
Asked what a Congress filled primarily with members elected from uncompetitive, single-party districts means (or would mean) for their trust in Congress, 60% of voters said they would be less likely to trust its decisions. Nearly half, 48%, said much less likely. Just 11% said it was more likely, and 29% said it would make no difference.
Among racial groups, this question produces the narrowest spread in the entire survey.
- Black voters: 69% less likely to trust
- AAPI voters: 64%
- White voters: 60%
- Hispanic voters: 57%
Twelve points separates the highest from the lowest. That compares to 28 points on proportional representation and 19 points on the Callais ruling. Congressional competitiveness is less polarized than the Voting Rights Act.
We’re Here for the Work Ahead
The redistricting fights now unfolding across multiple states are not abstract policy debates. For the campaigns, advocacy organizations, and communities doing this work, they are immediate, personal, and consequential. Public opinion on these issues is still forming, and it is forming differently in different states, among different communities, and at different speeds.
Change Research will continue tracking national and state-level opinion on voting rights and redistricting as this landscape evolves. For organizations working in affected states, we can help you understand how these questions are landing with the specific voters and communities you serve.
Custom polling is available now. Reach out here to start the conversation.
About This Survey
Polling was conducted online from May 5-10, 2026. Using Dynamic Online Sampling to attain a representative sample, Change Research polled 2244 registered voters nationwide. Post-stratification was performed on age, gender, race/ethnicity, education, region, urbanicity, and 2024 presidential vote. You can see a full methodology statement here, which complies with the requirements of AAPOR’s Transparency Initiative. Members of the Transparency Initiative disclose all relevant details about our research, with the principle that the public should be able to evaluate and understand research-based findings, in order to instill and restore public confidence in survey results.
Access the Full Data
Want the full crosstabs and data? Sign up for the Change Research Data Portal here. Already have an account? Sign in here.