Crooked Media/Change Research Poll of New & Infrequent Voters in Arizona, Florida, Michigan, North Carolina, Pennsylvania, and Wisconsin: September 9-13, 2020
Key Insights
- Despite the spotty voting records of the voters we surveyed, they’re highly engaged: 84% say they’ll definitely vote, and 76% rate their motivation a 10 out of 10. This confirms what other polls have suggested: turnout in this election is likely to be higher than ever, meaning more voters are in play than ever.
- Biden leads by 49-37 among these voters, who went for Hillary Clinton by 35-30. After messaging, Biden leads by 52-37, a bigger shift than we’ve seen in other polls. We also typically see far fewer undecided voters after messaging than the 6% we see here, underscoring the fact that there are a large number of persuadable voters in this universe.
- Undecided voters are largely negative about both candidates, but they’re much more strongly negative about Trump than Biden. What’s more, 41% of them have no opinion of Biden.
Horse Race
- Biden leads 49-37. Here’s how that breaks down by 2016 vote:
- He leads 91-3 among those who voted for Clinton
- Trump leads 88-4 among those who voted for him in 2016
- Biden leads 44-16 among Gary Johnson voters
- Biden leads 42-17 among Jill Stein voters
- Biden leads 47-32 among those who did not vote in 2016
- Biden’s lead among the three groups of voters we surveyed:
- Biden leads 44-43 among those who have only voted in 2016
- Biden leads 51-36 among those who registered after 1/1/16 (nearly half of whom are under 35)
- Biden leads 48-38 among those who skipped 2016 and have voted 0 or 1 times since.
- By state:
- Biden leads 50-36 in AZ
- Biden leads 52-37 in FL
- Biden leads 58-31 in MI
- Biden leads 47-38 in NC
- Biden leads 49-39 in PA
- Biden leads 43-41 in WI
- These voters are motivated and plan to vote. Despite many of these voters’ spotty history, 84% say they will definitely vote — suggesting that overall turnout will be very high. And 76% of all respondents rate their motivation level at 10 out of 10. Only 4% of these high-motivation voters are initially undecided, along with 16% of those between 6 and 9 out of 10, and 39% of those whose motivation is between 1 and 5.
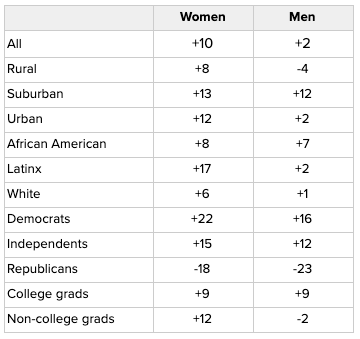
- Biden is doing better among these voters than Hillary Clinton did in 2016. His biggest gains over Clinton’s margin are among suburban voters, Latinx voters, young voters, and women. He sees a net gain of 13 points among suburban voters (13 among suburban women, 12 among suburban men), 10 among Latinx voters, 11 among voters under 35, and 10 among women compared with the Clinton-Trump margin.
- Biden is overperforming with women of nearly all categories. Biden’s gains over Clinton’s margins with most types of women far outpace his gains with the corresponding men: he’s gaining more with rural women than rural men; urban women than urban men; Latinas than Latinos, etc. There are just a few exceptions: he’s gained just as much with suburban men, college-educated men, and African American men as with the corresponding groups of women. The table below shows the difference between Biden’s initial lead and Clinton’s 2016 margin:

- Biden leads handily among infrequent voters of color. Biden leads 68-14 with African Americans in our sample, and 50-32 with Latinx voters. The Latinx numbers are better than Clinton’s performance with these same voters, while the African American numbers nearly equal his margins among all African Americans. 14% of African American respondents and 12% of Latinx respondents are undecided — both considerably higher than the 7% of white voters who are undecided. Finally, African American respondents are considerably less motivated to vote: 60% rate their motivation at 10 out of 10, much lower than the 72% among Latinx respondents and 80% among whites.
- Gary Peters is running a few points behind Biden with these voters, Mark Kelly a few points ahead, and Cal Cunningham is even. The number of undecided voters is slightly higher in each state’s Senate race than in the presidential race. It’s especially high in North Carolina, where 21% are undecided.
What’s Driving Votes
- Undecided voters are undecided primarily because 1) they dislike both candidates or 2) they don’t know enough about them yet. We asked a multiple-choice question about what would help undecided voters make up their mind, and an open-ended question about why they were undecided. In the former, “Researching more about the candidates” was the choice of 47%, followed by “Whether things get better or worse between now and the election” at 28%, “The debates” at 19%, and talking to family and friends at 6%.
- In the open-ended answers, we do see a lot about voters not knowing enough about the candidates, wanting to do more research, and quite a few voters not being able to sort out what’s true and false. But we see even more voters who dislike both candidates, or who are fed up with politics and politicians generally. Biden is significantly less unpopular with undecided voters than Trump: net -38, versus Trump’s -53, and with 21% feeling very unfavorable about Biden, while 46% feel very unfavorable about Trump. Finally, Biden leads 35-6 among all respondents who feel unfavorable about both candidates.
- Trump continues to get higher numbers on the economy than on other issues or overall. 49% approve of his handling of the economy, 39% of his handling of COVID, 41% on crime, and 42% of his overall job performance. That said, one of the groups that shifts the most after messaging is those who somewhat approve of Trump on the economy: they initially favor Biden by 36-29; after messaging, it’s 41-25. These tend to be voters who feel quite negative toward both candidates and both parties, are quite young and mostly identify as independents.
What Voters are Hearing and Believing
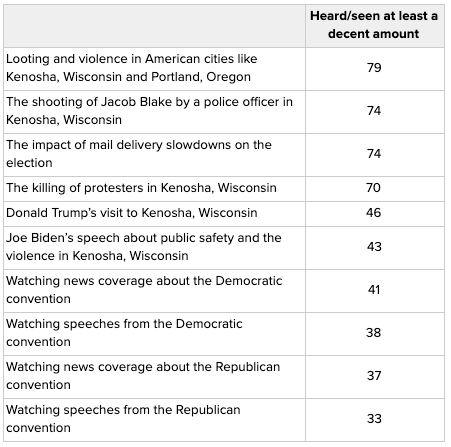
- These voters are hearing a great deal about ‘looting’ and ‘rioting,’ and nearly as much about the Jacob Blake shooting and its aftermath, and mail delivery slowdowns — but much less about the presidential campaign. This all, of course, varies considerably based on people’s news sources. People mostly saw coverage of the Republican convention and Trump’s Kenosha visit on Fox, while they were more likely to see coverage of the Democratic convention and Biden’s Kenosha visit on MSNBC. Voters in Wisconsin saw only slightly more coverage about the candidates’ visits: 57% heard at least a decent amount about Trump’s visit, and 45% about Biden’s. These voters have also been hearing more about police officers shooting Blake, and about the subsequent killing of protesters.

- The Woodward story was by far the top response on our open-ended question about what voters had heard about Trump. Roughly 25 percent mentioned the Woodward story. The Atlantic story was mentioned by slightly over 10 percent of respondents. Notably, many Trump voters mentioned the “lies” in the Atlantic story, while virtually none questioned the veracity of the Woodward story. Another 3 or 4 percent mentioned the Nobel nomination.
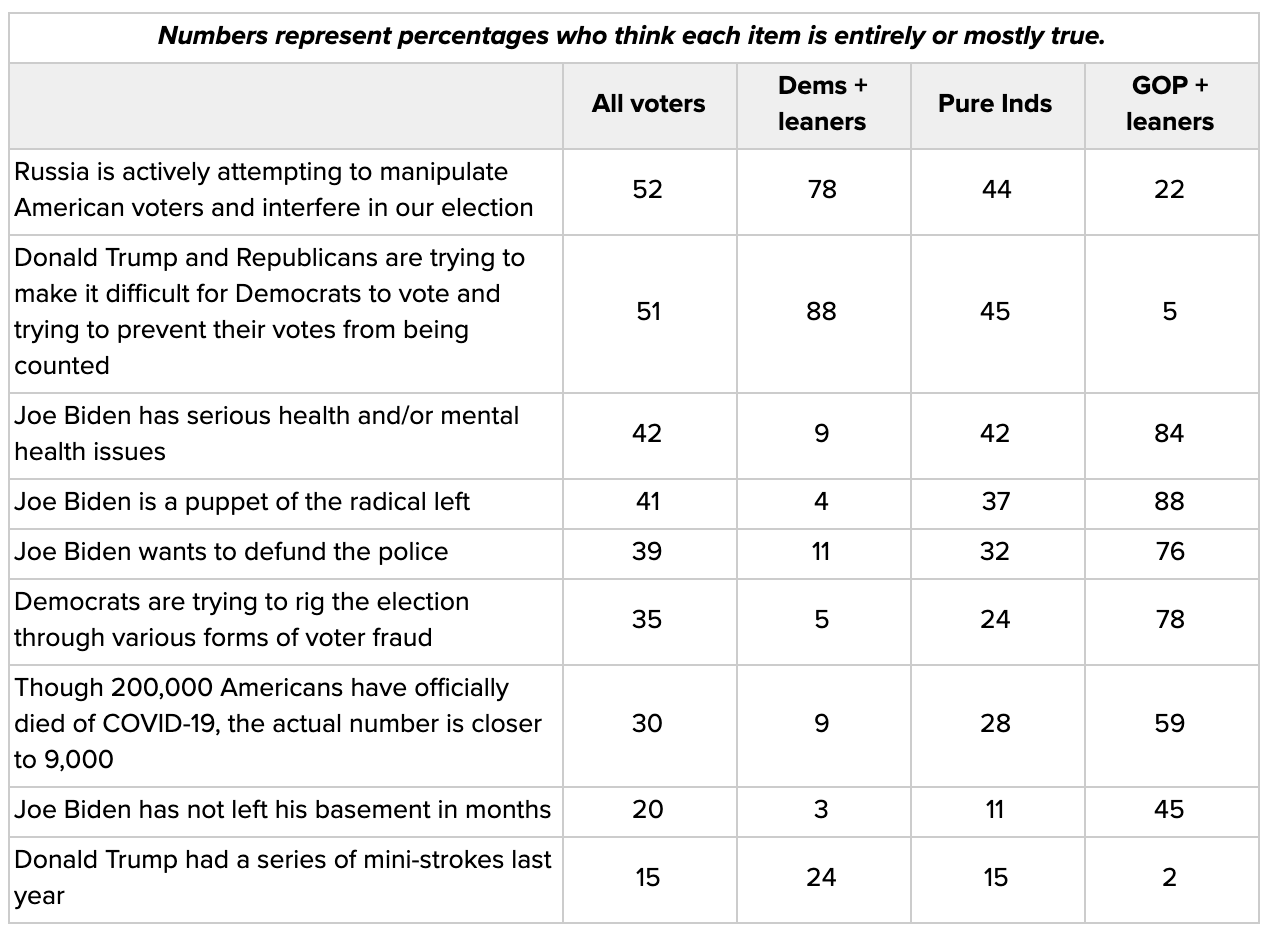
- A plurality of Republicans + Republican-leaning independents believe every single conspiracy theory and falsehood we asked about. 84% of Republicans and Republican-leaning independents — along with 42% of independents who lean toward neither party — think Biden has serious physical or mental health issues. Over 30% of pure independents also believe that Biden is a puppet of the radical left and that he wants to defund the police.
More voters believe Trump is trying to suppress the vote, and that Russia is interfering, than that Democrats are trying to rig the election — but a minority of pure independents and very few Republicans believe either of the first two.

Vaccine
- Only 5% would take a vaccine as soon as possible, even if it has not gone through standard safety procedures. 23% of Democrats and Democratic-leaning independents would take it as soon as possible, while 10% of Republicans and leaners would. But among those who say they’ll take it as soon as possible, the numbers are flipped: 25% of Democrats and leaners would take it even if it hasn’t undergone all safety measures, while 47% of Republicans and leaners say the same. Overall, 5% say both that they’ll take it as soon as possible, and stick with this answer even in the event that all safety precautions have not been taken.
For media inquiries, please email [email protected]
Change Research surveyed 3,098 new and infrequent voters in Arizona, Florida, Michigan, North Carolina, Pennsylvania, and Wisconsin. This included 556 who only voted in 2016; 1,437 who registered after 1/1/2016; 1,041 who were registered before 2016, skipped 2016, and have voted in 0 or 1 elections since. These subsamples represent the proportion of each of these groups across these six states. The poll was conducted September 9-13, 2020. The margin of error, as traditionally calculated, is ±1.8%. Change Research reaches voters via targeted online ads that point people to an online survey instrument and via text to web from a voter file sample. Our Dynamic Online Sampling establishes and continuously rebalances advertising targets across region, age, gender, race, and partisanship to dynamically deliver large samples that accurately reflect the demographics of a population. Post stratification was done on age, gender, and race.
