Policy Positions Top Reason Voters Donate to Candidates
Change Research Grassroots Donation Survey : June 19-21, 2019
Key Takeaways:
-
44% of Democratic primary voters have donated to at least one Democratic candidate for president.
-
Democratic primary voters are most compelled to donate to a candidate when the candidate is only relying on small donations (62%) or releases a policy vision the voter agrees with (62%).

Look beyond the horse race:
purchase polls from our frequent polling series.
Change Research surveyed 1,071 Democratic primary voters nationwide on their motivations to donate to political candidates. The poll produced thousands of data points powering actionable insights for campaigns and organizations seeking grassroots donations. This page contains a preview of the survey’s findings – inquire about purchasing the full poll.
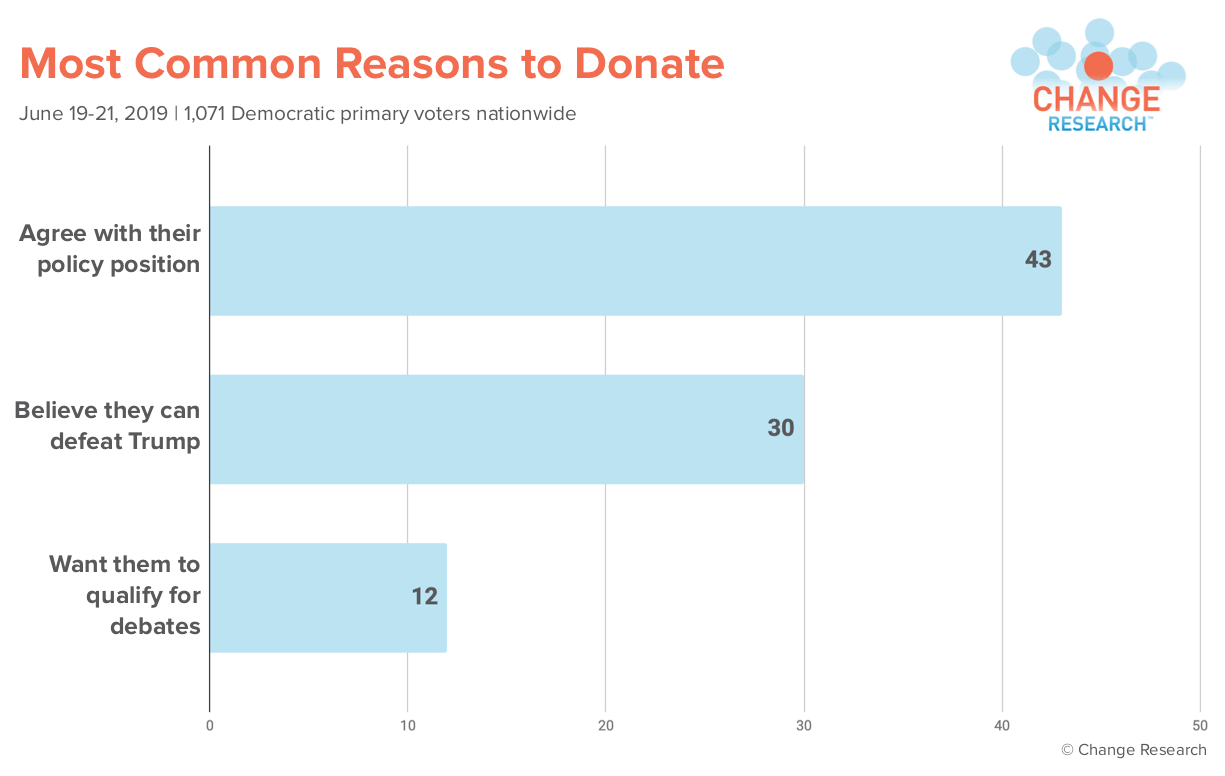
Agreement with a Candidate’s Policy Positions is Most Common Reason to Donate
The most common reasons Democratic primary voters donate to a Democratic presidential campaign are because they agree with the candidate’s policy positions (43%), they believe the candidate can defeat Trump in a general election (30%), and they want them to qualify for debates (12%).
Every poll includes:
-
full crosstabs
-
an open-ended question analysis powered by Change Research’s natural language processing technology
-
an executive summary
Want more customization?
Don’t Miss a Poll
Get Results Sent to Your Inbox{{gallery_id=dataItem-jxwaigj5}}
Media Contact
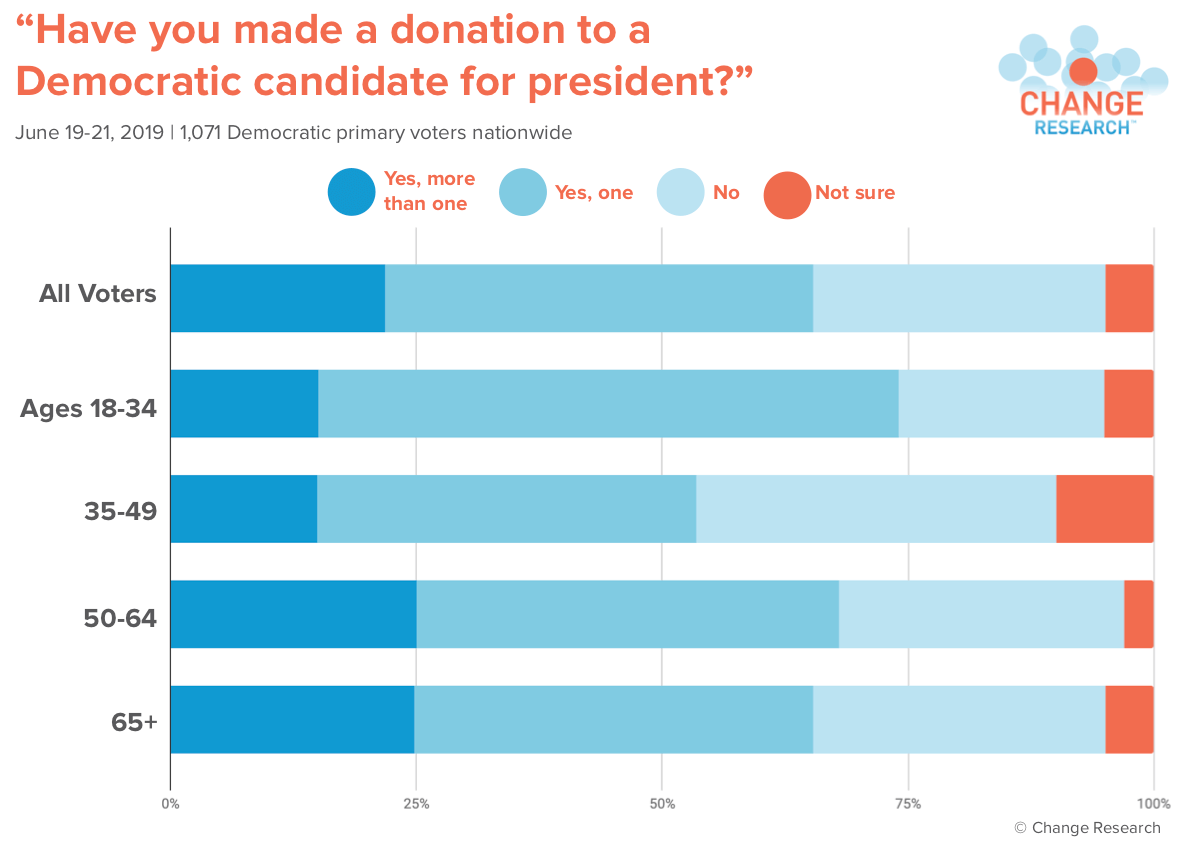
Majority of Democratic Primary Voters Have Donated to One or More Democratic Candidates
66% of Democratic voters nationwide have donated to at least one Democratic candidate for president. Voters ages 18-34 have donated to the most candidates, with 74% having donated to at least one candidate; 15% have donated to more than one candidate.
Limited Poll Info
[TOPLINES] Change Research __ Post-Debat
[TOPLINES] Change Research __ Grassroots
Sample and Methodology _ Post-Debate 6_2
Sample and Methodology _ Grassroots Dono
Full crosstabs and more available for purchase. Learn more here.
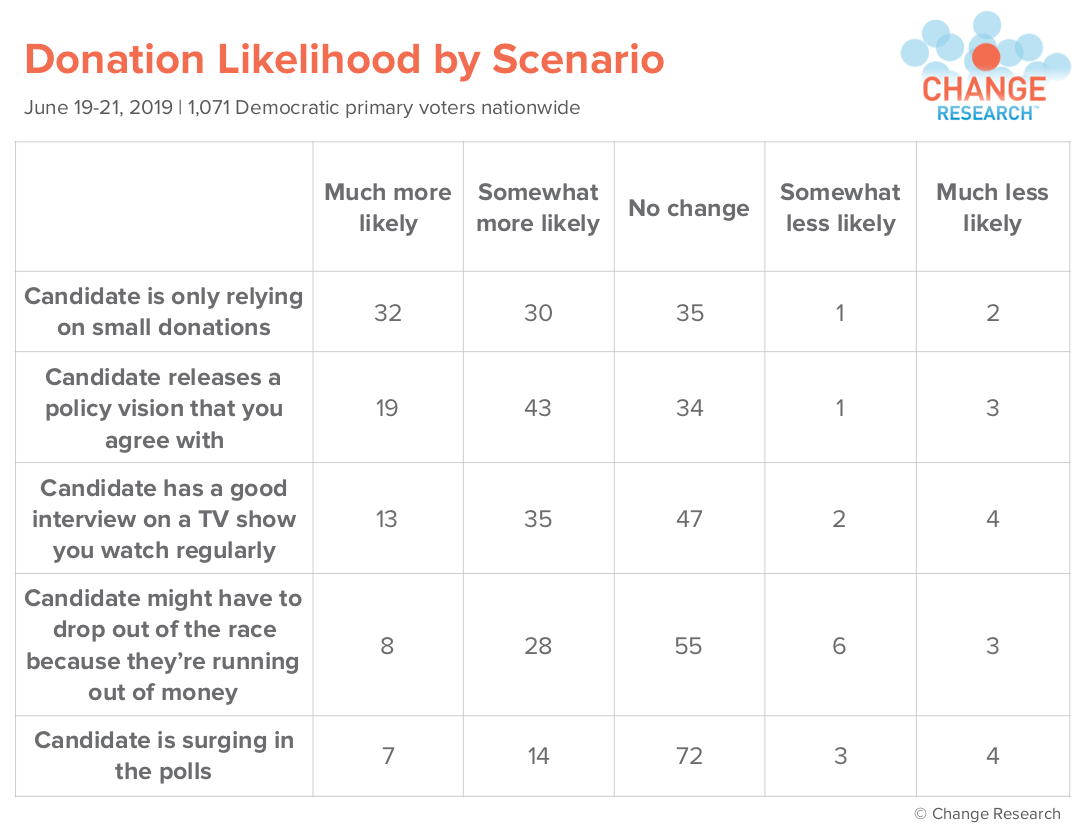
Candidate’s Reliance on Small Donations Increases Likelihood of Donation
Among several scenarios that might compel a voter to donate to a campaign, voters indicated that they are most likely to contribute when a candidate is only relying on small donations (62%), or when a candidate releases a policy vision that the voter agrees with (62%). 48% are more likely to donate when a candidate has a good interview on a show the voter watches regularly.
2020 Change
You’ve seen the horse race results in the headlines – now Change Research’s 2020 Change polling series is offering candidates and causes an opportunity to access deeper insights for a strategic advantage.
2020 Change is a series of individual polls and aggregate polling memos offering you maximum flexibility in accessing the data that will be most impactful for your mission.
The polls cover local issues far beyond the Democratic nomination, providing actionable insights for those working on ballot measures, issue advocacy campaigns, down-ballot races, or other legislative initiatives.
You can buy a single poll, a series of polls from a specific state (ex. California polls only), or choose the combination that’s right for you. Purchase a poll or series of polls to gain access to surveys of large samples of Democratic primary voters across demographic groups and areas of the United States.
Learn more about purchasing polls.
Change Research surveyed 1,071 Democratic primary voters nationwide from June 19-21, 2019. The survey was conducted online, using Change Research’s Bias Correct Engine. Change Research reaches voters via targeted online ads that point people to an online survey instrument. The Bias Correct Engine dynamically delivers large samples that accurately reflect the demographics of a population. Post-stratification was done on age, gender, ethnicity, and 2016 presidential vote. The margin of error for the full sample, as traditionally calculated, is ± 3.0%.