In 2020 poll results were imperfect. Yet again, in some of the most important states and races polls were way off. As can be expected, some pollsters did better than others, some races had more accurate polls than others, and some regions seemed easier to predict.
Some of the failures of 2020 can be ascribed to outdated technologies – for example, relying on phone surveys, when only about 1 in 100 adults will answer a call from an unknown number to take a survey. Others have to do with misunderstanding shifts in public opinion, systematic under-sampling of certain groups, or failures to predict the appropriate balances in the electorate.
Polling firms’ ability to analyze the errors of this election cycle and willingness to make bold, corrective decisions for the future will undoubtedly play a huge role in elections from this point forward. The stakes are high: success will lead to better resource allocation, clearer expectations going into election night, and, as a result, greater faith in our Democracy, while failure will lead to waste and further distrust in our country’s political process.
Whatever the challenges of the polling industry broadly, Change Research is committed to transparency and seeks to lead the polling industry into 2021 with a comprehensive look at what went right and what went wrong with its polling and comparatively against others. This cycle, like others, CR has successes to celebrate and failures to understand.
The Polls in 2020 at Large
First, here’s what we saw in the six most heavily polled states in 2020 across the polling industry:
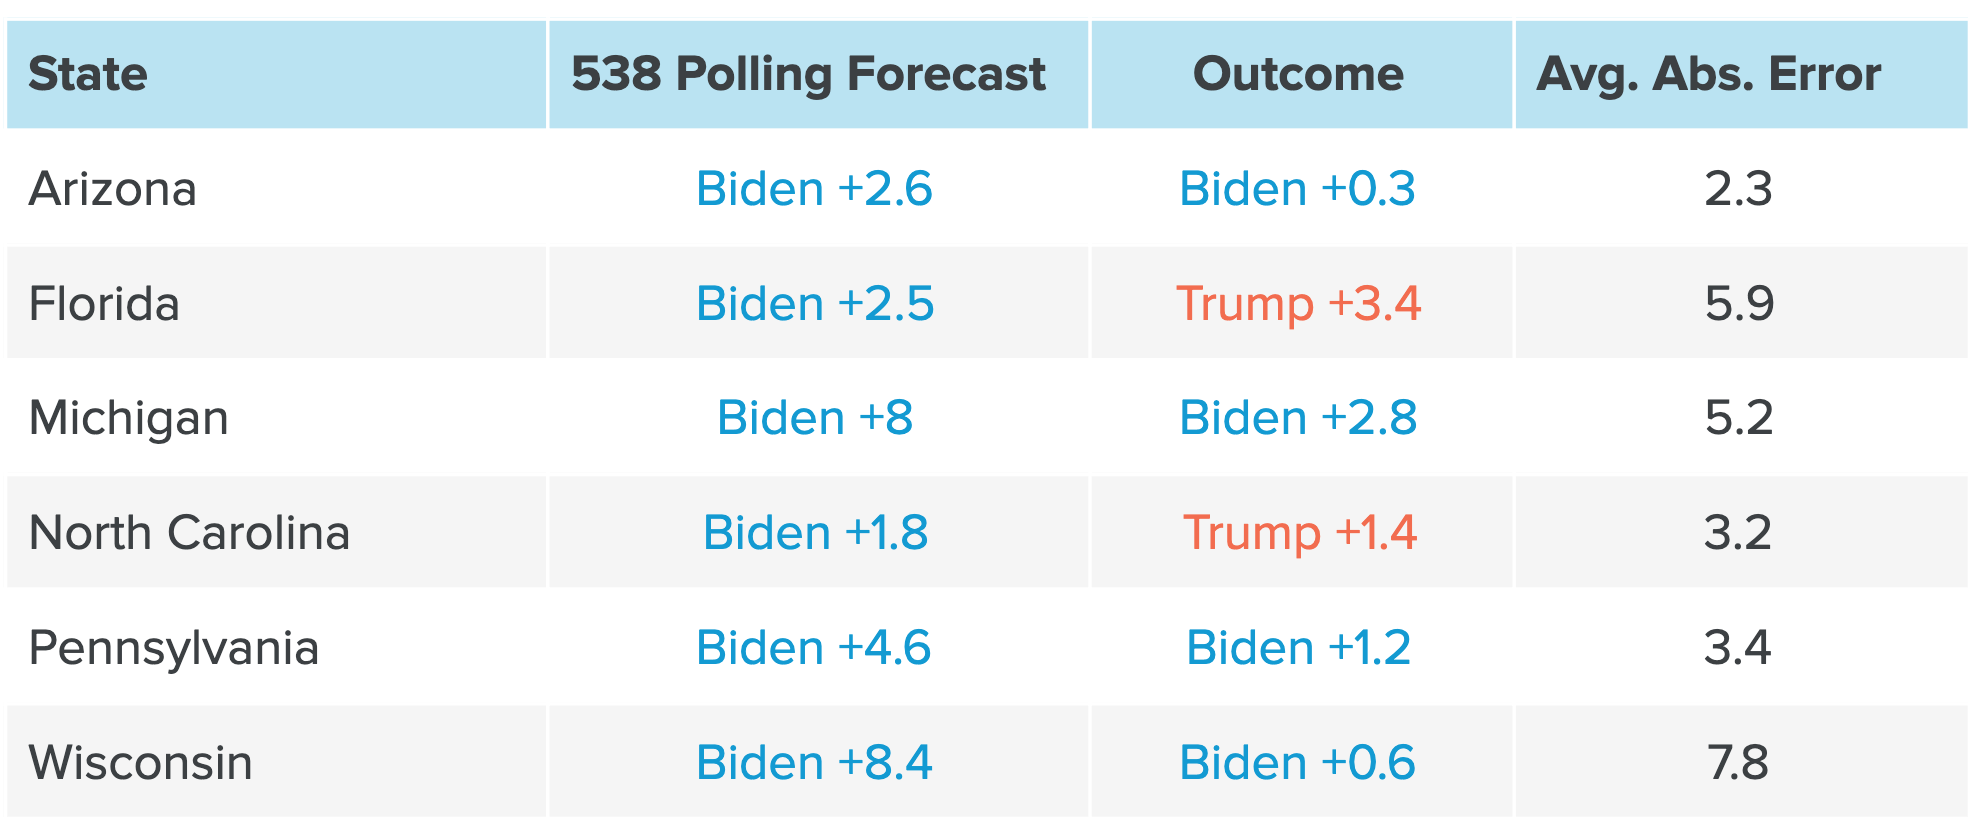
In these six states, polls pointed to outcomes that were on average 4.6 points better for Biden than the actual election results.
The polling industry had similar challenges in Congressional races. A David Wasserman article from Cook Political Report stated: “District-level polling has rarely led us — or the parties and groups investing in House races — so astray.” While Cook predicted that Democrats would expand their majority by 10-15 seats, with the possibility of expanding it by 20, Republicans actually gained 10 seats, flipping 13.
And in Senate Races:
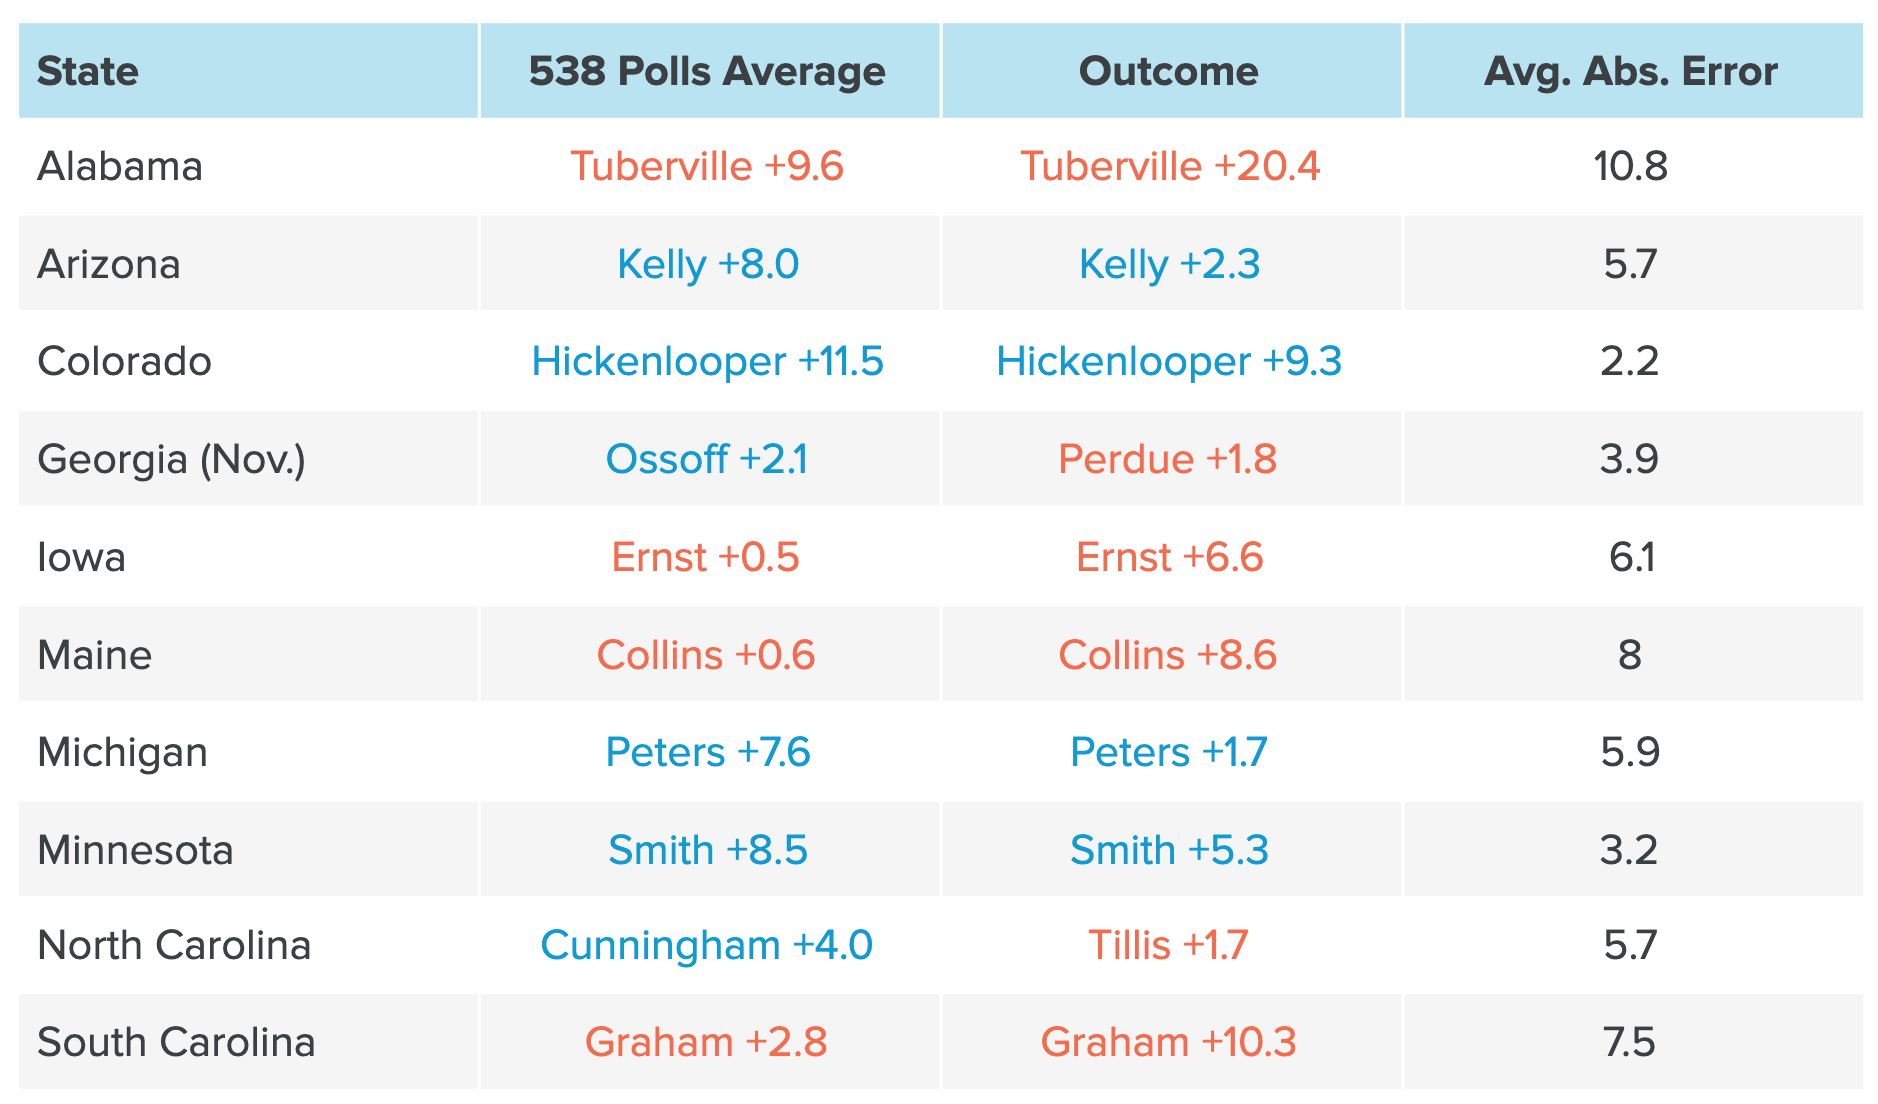
This polling led to very poor resource allocation. Joe Biden went to Ohio on November 2nd where he wound up losing by eight points. Democrats poured hundreds of millions of dollars into races for Senate, Congressional and state legislative offices where their candidate lost by double-digit margins.
Change Research Polls in 2020
Battleground State Polling
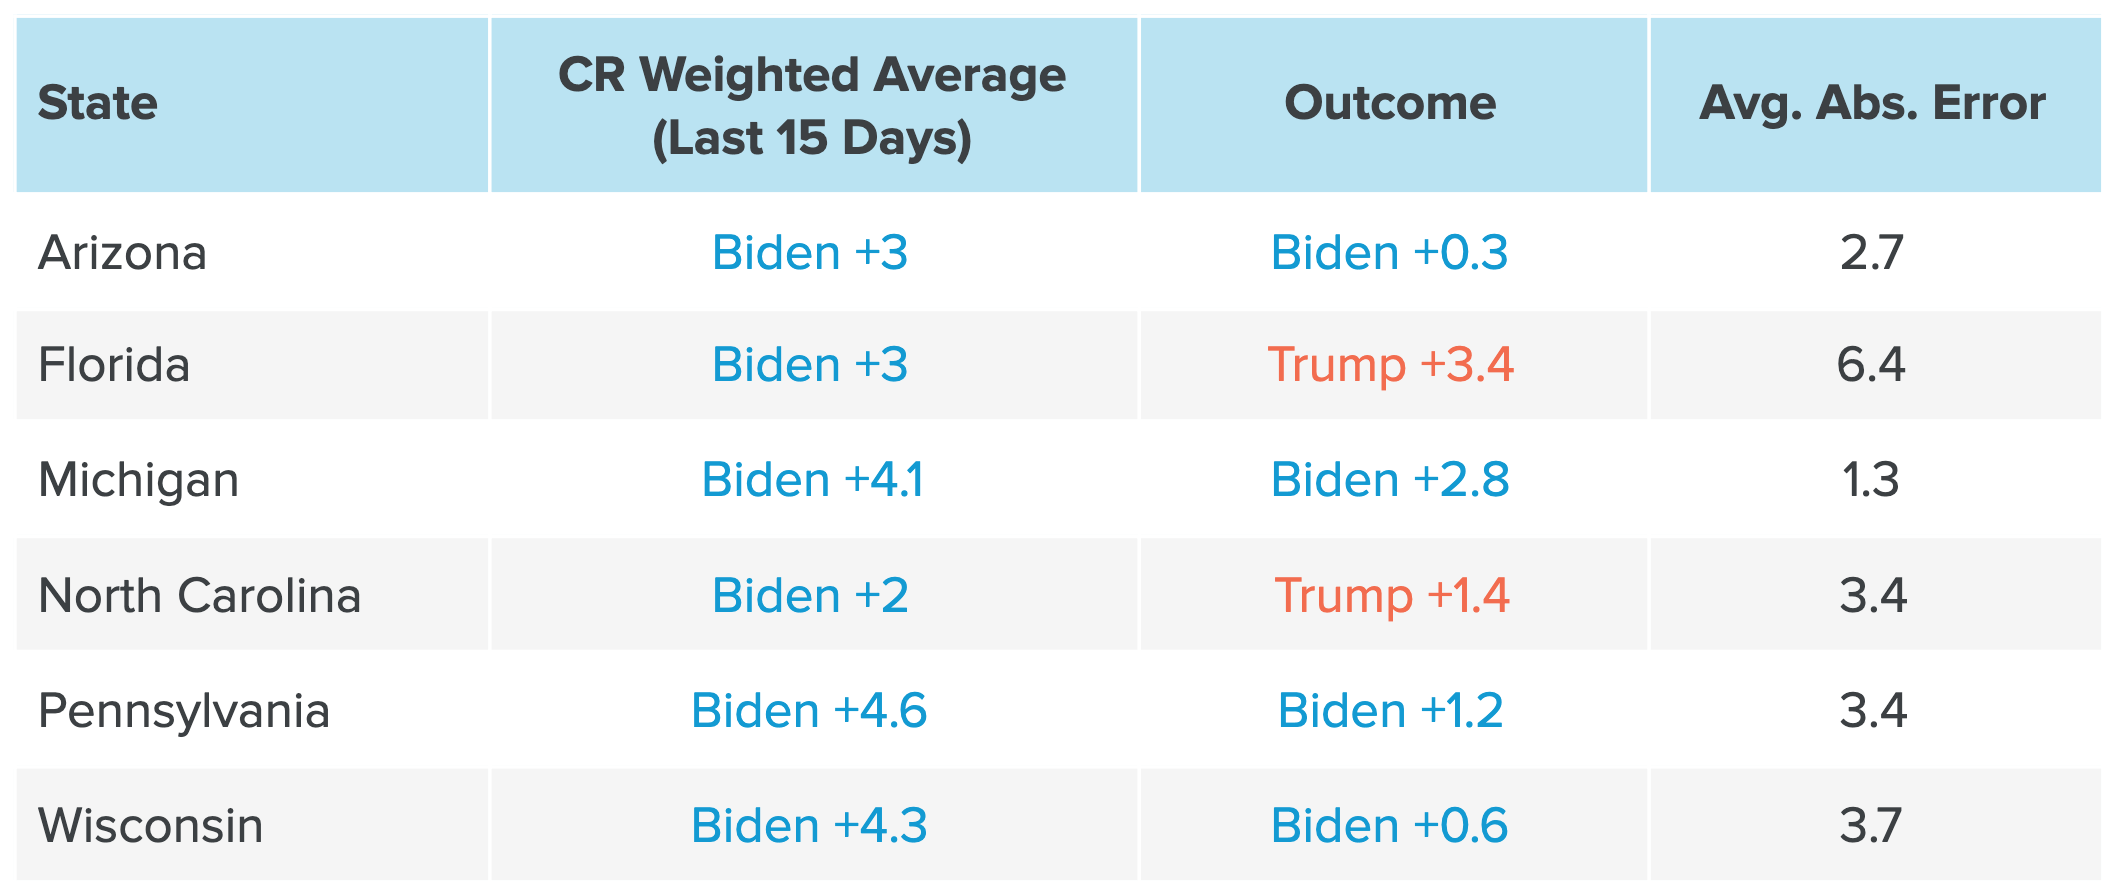
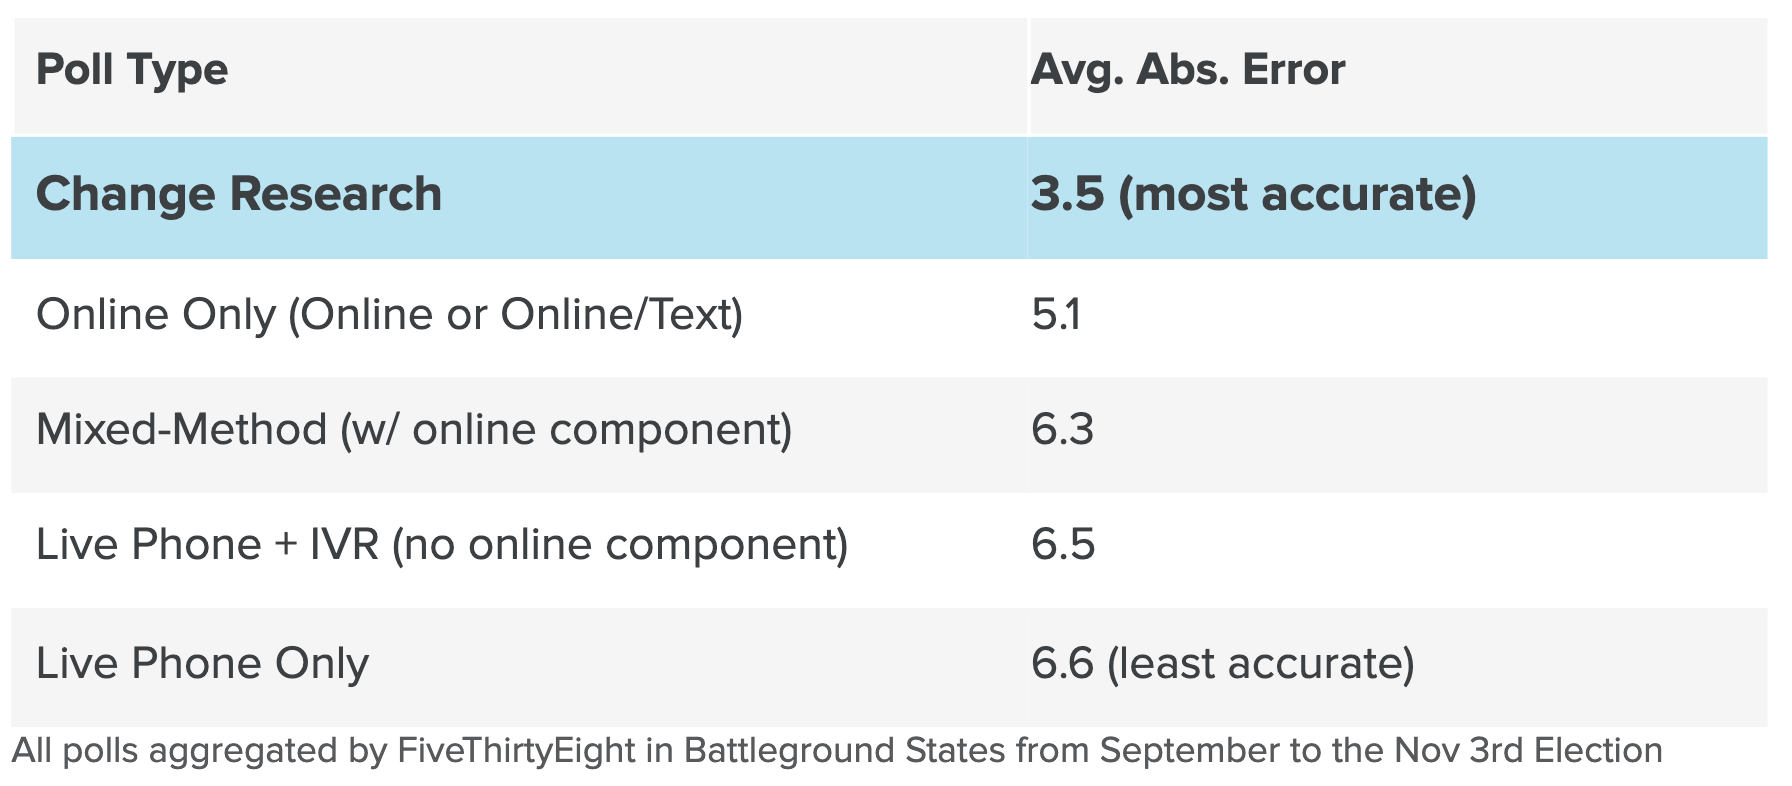
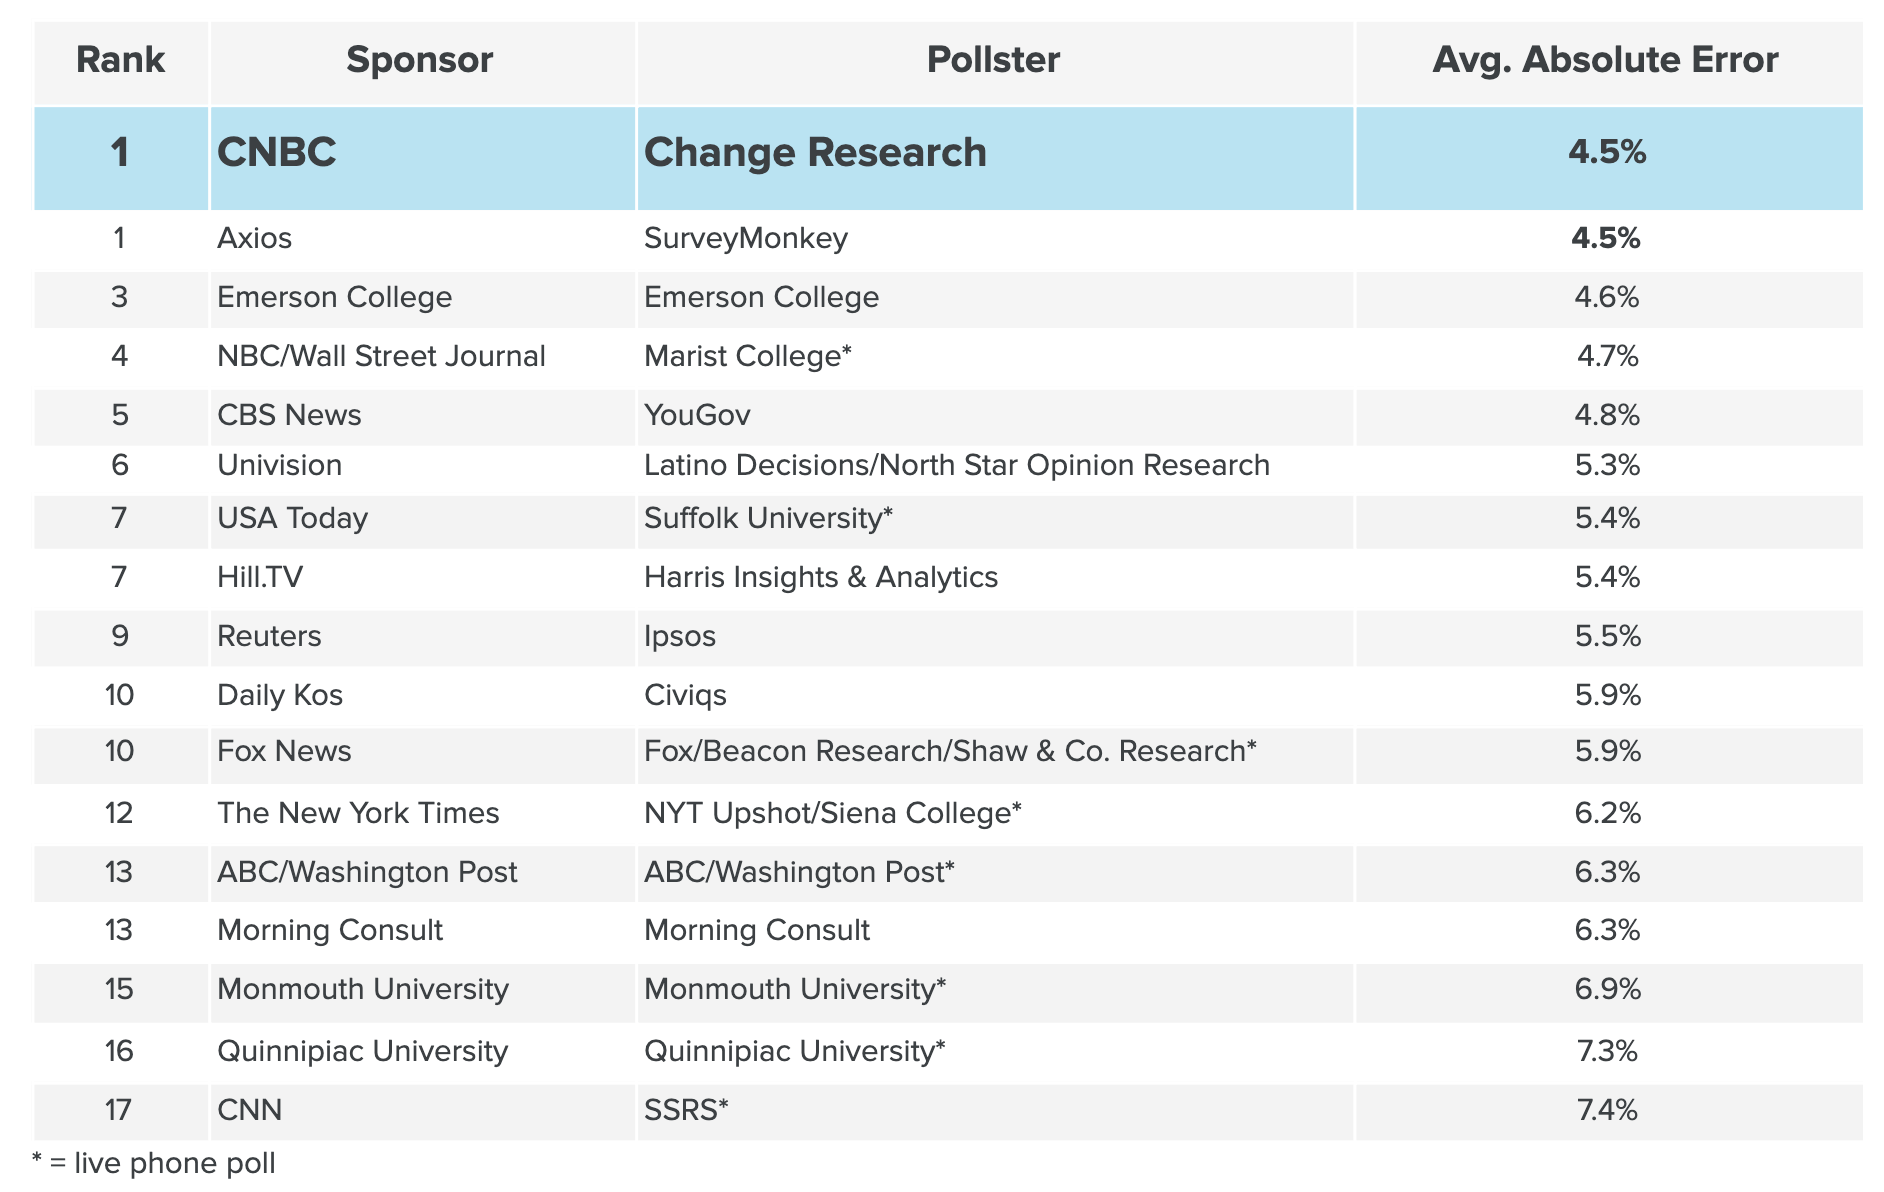
In 2020, Change Research’s private and public polls were nearly 25% more accurate than other pollsters in battleground states — with an average absolute error of 3.5 points in the presidential race across all polls in AZ, FL, MI, NC, PA & WI in the two weeks leading up to November 3rd. Overall, live phone polling, once considered a “gold standard,” fell especially short: live phone pollsters were 23% less accurate than polls conducted online and 48% less accurate than Change Research’s polls.
Media Polling in the Battleground
Change Research conducted Battleground State polling with CNBC throughout the election cycle, and comparing the results to those of other media pollsters, the difference is clear. Online media polling was more reliable than phone polling.
U.S. Senate Polling
Change Research ran 27 polls for U.S. Senate Races in 2020, with an average error of 5.7. The average error of the over 500 Senate polls aggregated by FiveThirtyEight was 6.1.
Change Research did particularly well in Minnesota and Michigan. In the final Change Research Minnesota poll, conducted with MinnPost, Democrat Tina Smith led Republican Jason Lewis by 4, within one point of the actual result. Change Research was closer than any other pollster aggregated by FiveThirtyEight. FiveThirtyEight’s forecast had Smith leading by +12.3, a 7 point error. In Change Research’s final polls in Michigan (for ImmigrationHub and CNBC) Democratic candidate Gary Peters was ahead by 6 and 5 points, with an average error of 3.8; FiveThirtyEight’s forecast error was 5.3.
U.S. House Polling
Change Research conducted 28 polls in congressional races in 2020 with an average error of 6.88. There were 214 congressional polls aggregated by FiveThirtyEight after Labor Day: the average error was 8.09.
State Legislative Polling
Change Research’s state legislative polls — many in districts with under 100,000 people — stood out for their accuracy. One of the only pollsters conducting online polling in state legislative districts, Change Research conducted:
- 77 polls in State Senate Districts with an average error of 5.94
- 84 polls in State House/Assembly Districts with an average error of 5.95
The table below shows the average error in state legislative polls in states where Change Research conducted more than 10 polls.
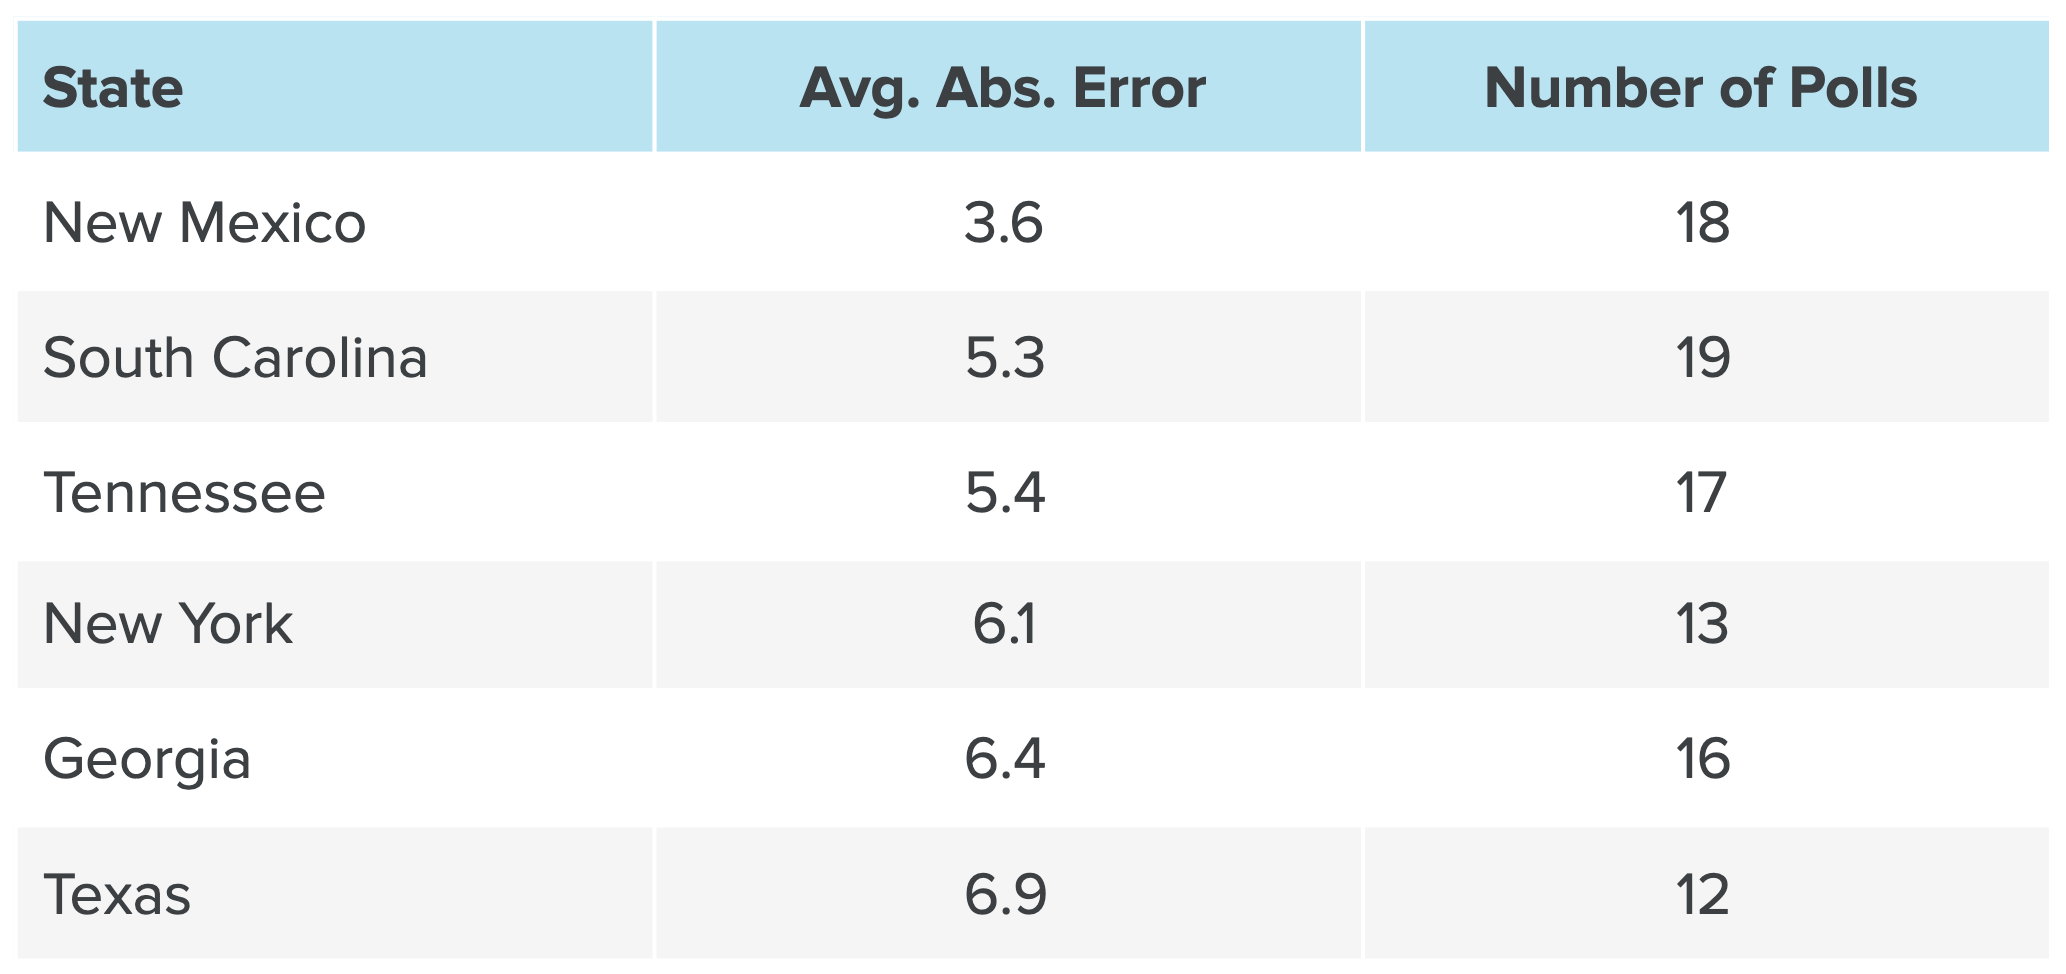
Many of these polls were in very small districts, and had samples of 300-400 respondents and were still quite accurate. Also notably, the numbers above indicate accuracy for named ballots (e.g., James Smith the Democrat vs. Anne Rodriguez the Republican). It is often the case that unnamed ballots (the Democrat vs. the Republican) can be more accurate in races with low candidate name recognition.
It is no secret that with more accurate data, state parties, caucuses and candidates can more efficiently use resources for races up and down the ballot. Polls with higher Democratic biases led to spending in tough races in 2020 – like Senate reaches in Kentucky, Kansas, and South Carolina, leaving easier races under-resourced, despite their higher chance for success. Meanwhile, Change Research was able to advise campaigns and PAC’s on where to focus their efforts, leading to greater success.
Explaining Accuracy
Change Research’s success in polling in 2020 can be attributed to methodology. Polling online means that Change polls get much closer to a random sample than is possible with phone polling, given current response rates to phone calls. Furthermore, Change Research’s targeting system does not rely on panels, which means that each survey is made up of completely fresh respondents, rather than a group of experienced survey takers who have their own sets of biases. Still, in modern polling there is no such thing as a truly random sample, and Change Research’s approach starts with an understanding of that.
Change Research partners in at least half a dozen states have said that Change polls had come in more conservative than polls from other pollsters. While we wish we had been wrong, accurate polling – even if not of the desired result – gives campaigns the chance to make the best decisions for their candidates.
Change Research’s Presidential Modeling in 2020
In addition to success with polling itself, Change Research had the most accurate Presidential vote model. We were both more accurate and less biased than both FiveThirtyEight and the Economist.
Change Research was able to leverage an immense amount of data–over 900,000 surveys taken in 2020–without pre-aggregation. That means Change Research’s models incorporated individual-level data from hundreds of thousands of individual survey respondents, facilitating a far more nuanced model than that of 538’s which only uses a few hundred pre-weighted polls.
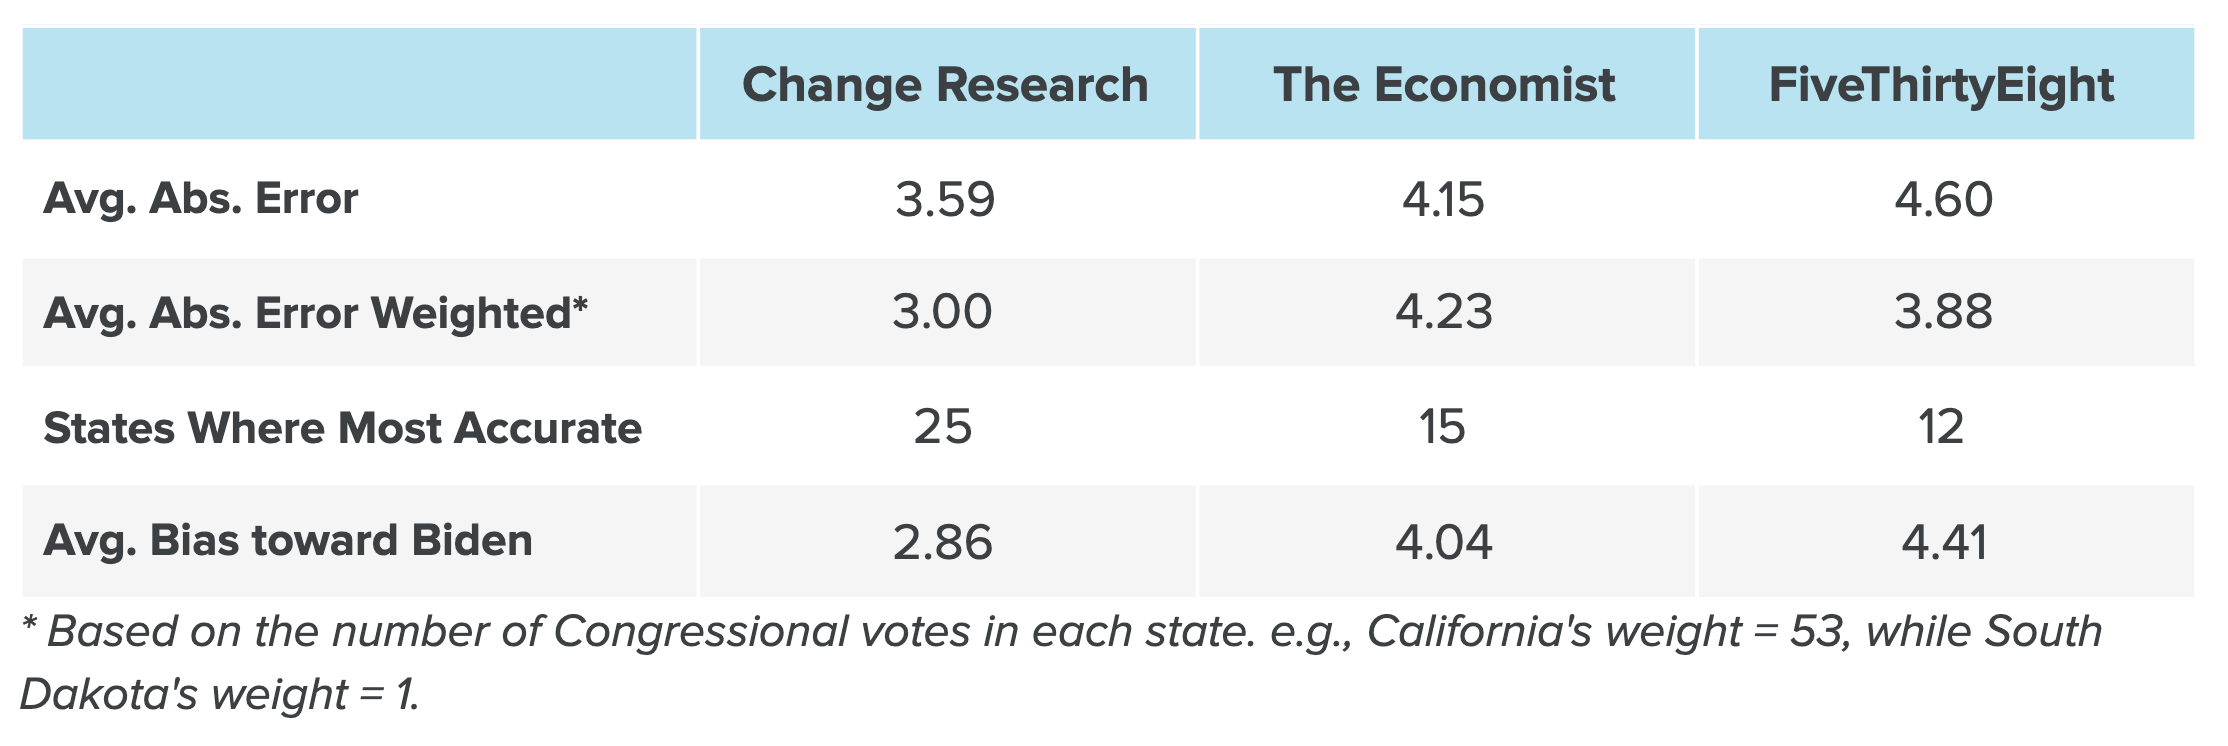
Having polled in all 50 states, Change Research modelling succeeded in every region of the country. With the exception of the South, Change Research did better than both FiveThirtyEight and the Economist.

Change Research’s presidential forecasts in the Northeast were uncannily accurate: the model projection was within a point of the actual result in New York, New Jersey, Pennsylvania, Massachusetts, Maryland, and Rhode Island, and within 0.01 in Connecticut.
Change Research’s presidential forecasts were also within two points in Washington, DC, Georgia, Michigan, Minnesota, Missouri, Virginia, Vermont, and Washington.
Using modeling technology and the ability to aggregate thousands of polling responses in order to build robust models is significantly better than relying on individual polls. The polling industry must capitalize on available data science techniques and technology to provide campaigns and causes up and down the ballot with the most accurate information.
Where Change Research Got it Wrong
Still, this was a difficult year for polling, and Change Research was not immune to the challenges that polling posed.
Like other pollsters, Change fell victim to the fallacy of random sampling in our polls of over 10,000 people in Miami-Dade County in South Florida. We saw Democrats losing more ground in that county than in any other major county in the U.S. Our polling suggested eight percent of Miami-Dade County 2016 Hillary Clinton voters would flip to Trump, a number far higher than every other major county in the U.S.
In a memo to allies, Change Research warned that
among non-college Latino male Clinton voters who live in areas that are predominantly Cuban, an astounding 26% plan to vote for Trump. This is a large voter segment in Florida, and it represents a scary trend.
But the warning understated the size of the problem. Change Research’s numbers pointed to a 20-point Biden lead in Miami-Dade County, a modest change from Hillary Clinton’s 29-point lead there in 2016. On election night, we found out just how far off we were: Joe Biden won by only seven points in Miami-Dade County. Election returns suggest that about twenty percent of 2016 Clinton voters in Miami-Dade County voted for Donald Trump in 2020 — more than double what our polls suggested. In other words, our survey takers in Miami-Dade County were simply not reflective of the full electorate.
Further, In FL-CD 15, for example. Change Research had Franklin +2 (46% Franklin to 44% Cohn), St. Pete Polls had Franklin +8 (49% Franklin to 41% Cohn), and DCCC had Franklin +3 (42% Franklin to 39% Cohn). The final results were Franklin +10.8 (55.4% to 44.6%).
Several explanations have been proposed to explain these discrepancies. First, undecided and third party voters may have gone overwhelmingly for Trump (and other Republicans). Second, when the pandemic started, survey response rates among Democratic voters may have gone way up and never went down, leading to non-representative samples. Finally, Republicans that support Trump may be significantly less likely to respond to polls. We believe these are all unlikely explanations, but we are guided by data, and are conducting a deep analysis of our data as well as data from voter files as it comes in, along with precinct and county results, in order to better understand which explanations are most accurate.
The Past Was Representative; The Future is Actionable and Predictive
It’s time to change the way we think about polling.
Thirty years ago, there was a gold standard approach to polling. Pollsters called people on their home phones in the evening. Americans sitting at home gladly answered those calls and took surveys, allowing pollsters to affordably find a representative sample of survey respondents.
Today, fewer than one in 100 people answers their phone and completes a survey. Phone polls aren’t representative and — as we saw in this year’s election — they’re less accurate than online polls.
It’s time to bury the idea that polls can be truly representative. If there is a future gold standard of measuring public opinion, it’s predictiveness and actionability. Does a survey — or any other means of measuring public opinion — actually predict something that can ultimately be verified? Can it provide insight that is strategically useful?
As we look back on 2020 and more deeply understand which of our pre-election assumptions were right, and which were not, we’ll be pushing on making our offerings more predictive, and more actionable going forward.
