Americans are largely content about many aspects of their healthcare, but rising costs for both health and home insurance are squeezing many American households.
Health Insurance: Good Access but Higher Costs
Feelings about the state of health insurance in the U.S. are mixed. Nearly two thirds of voters (65%) positively rate their ability to access the health care their family needs, with 30% rating their access to needed healthcare as “excellent.” While voters across demographic groups show satisfaction with access, the intensity of that satisfaction varies greatly by age and income: voters over 65 are much more likely than any other age cohort to rate their healthcare access as “excellent” (37%). Moreover, half of voters who make over $150,000 rate their healthcare access as “excellent,” while just 20% of those making less than $50,000 feel the same.
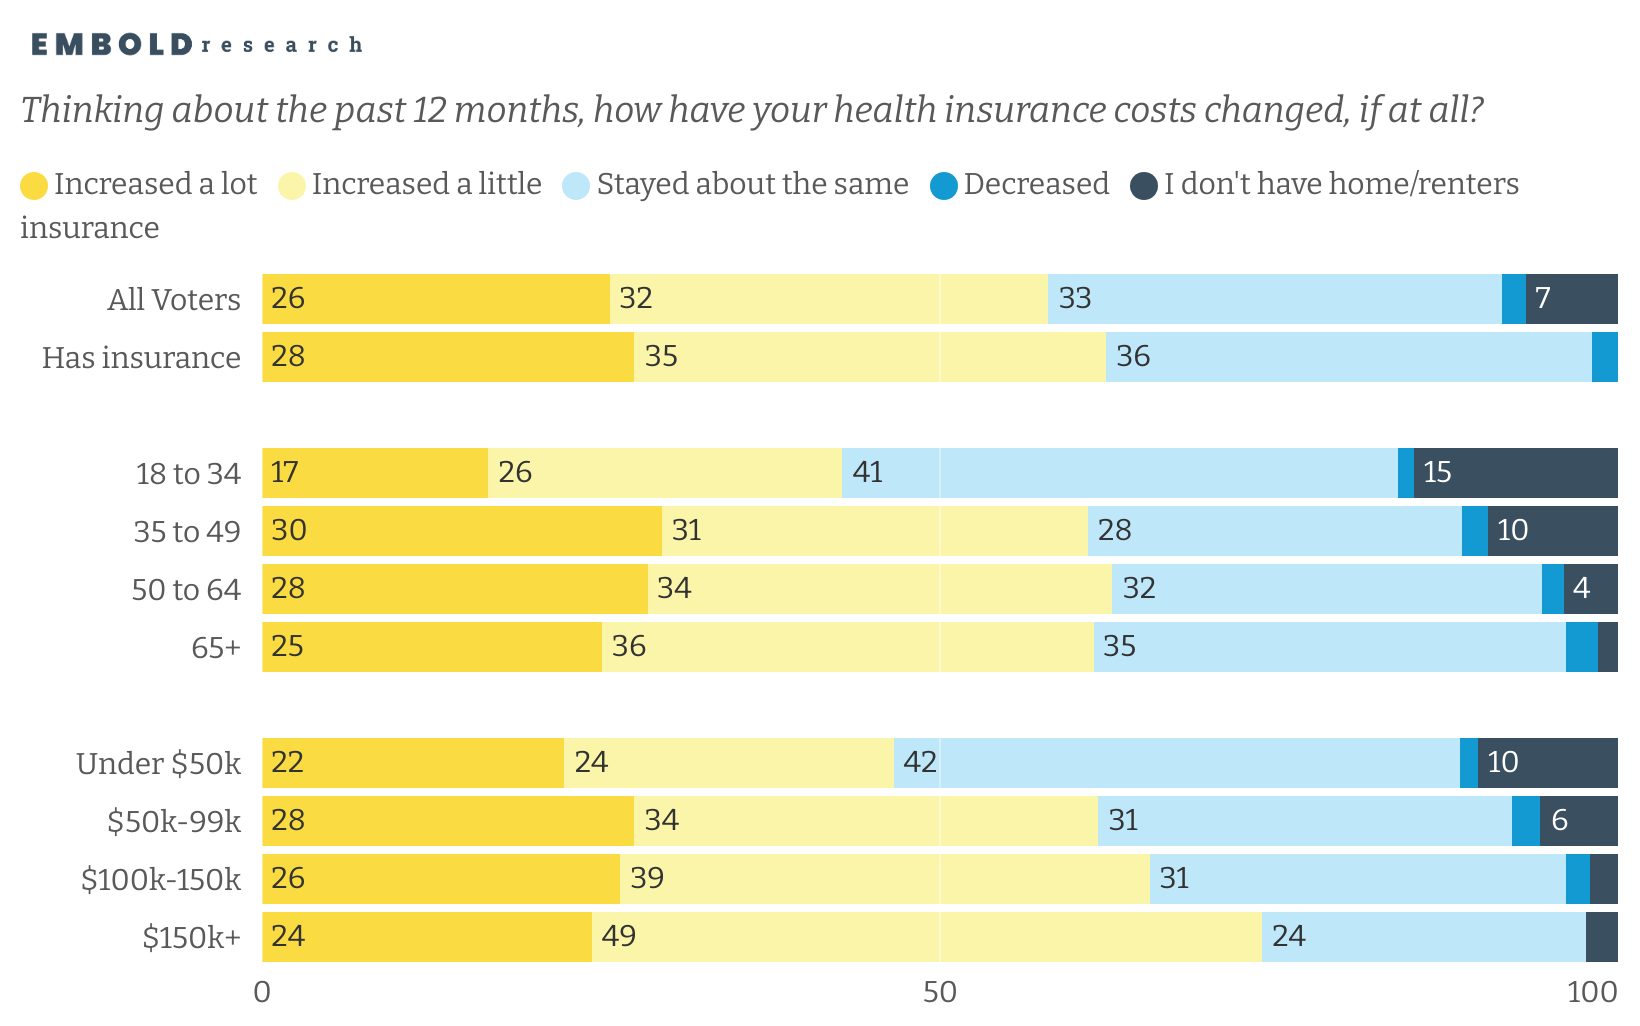
While many are satisfied with their access, a majority of insured voters indicate that they have faced health insurance cost hikes in the past year — 62% report increases, including 28% who say costs have increased a lot. Only 2% say their costs have gone down.
While reports of increased costs are roughly the same across demographic groups, coverage gaps remain stark, with the most vulnerable concentrated among younger and lower-income voters:
- Younger voters are far more likely to be uninsured: 15% of voters under 35 and 10% of those ages 35 to 49 lack health insurance, compared to much lower rates among older voters.
- Lower-income households, particularly those earning under $50K a year, are also more likely to be uninsured.

Value perceptions are split. Overall, 43% feel they are getting good value for their insurance, while one-third disagree and 23% are neutral. The 35–49 age group stands out as the most dissatisfied, with 49% feel they are not getting good value. Voters over 65, who rated their access to healthcare the most positively out of any age group, are also the most content with the value they get (59%).
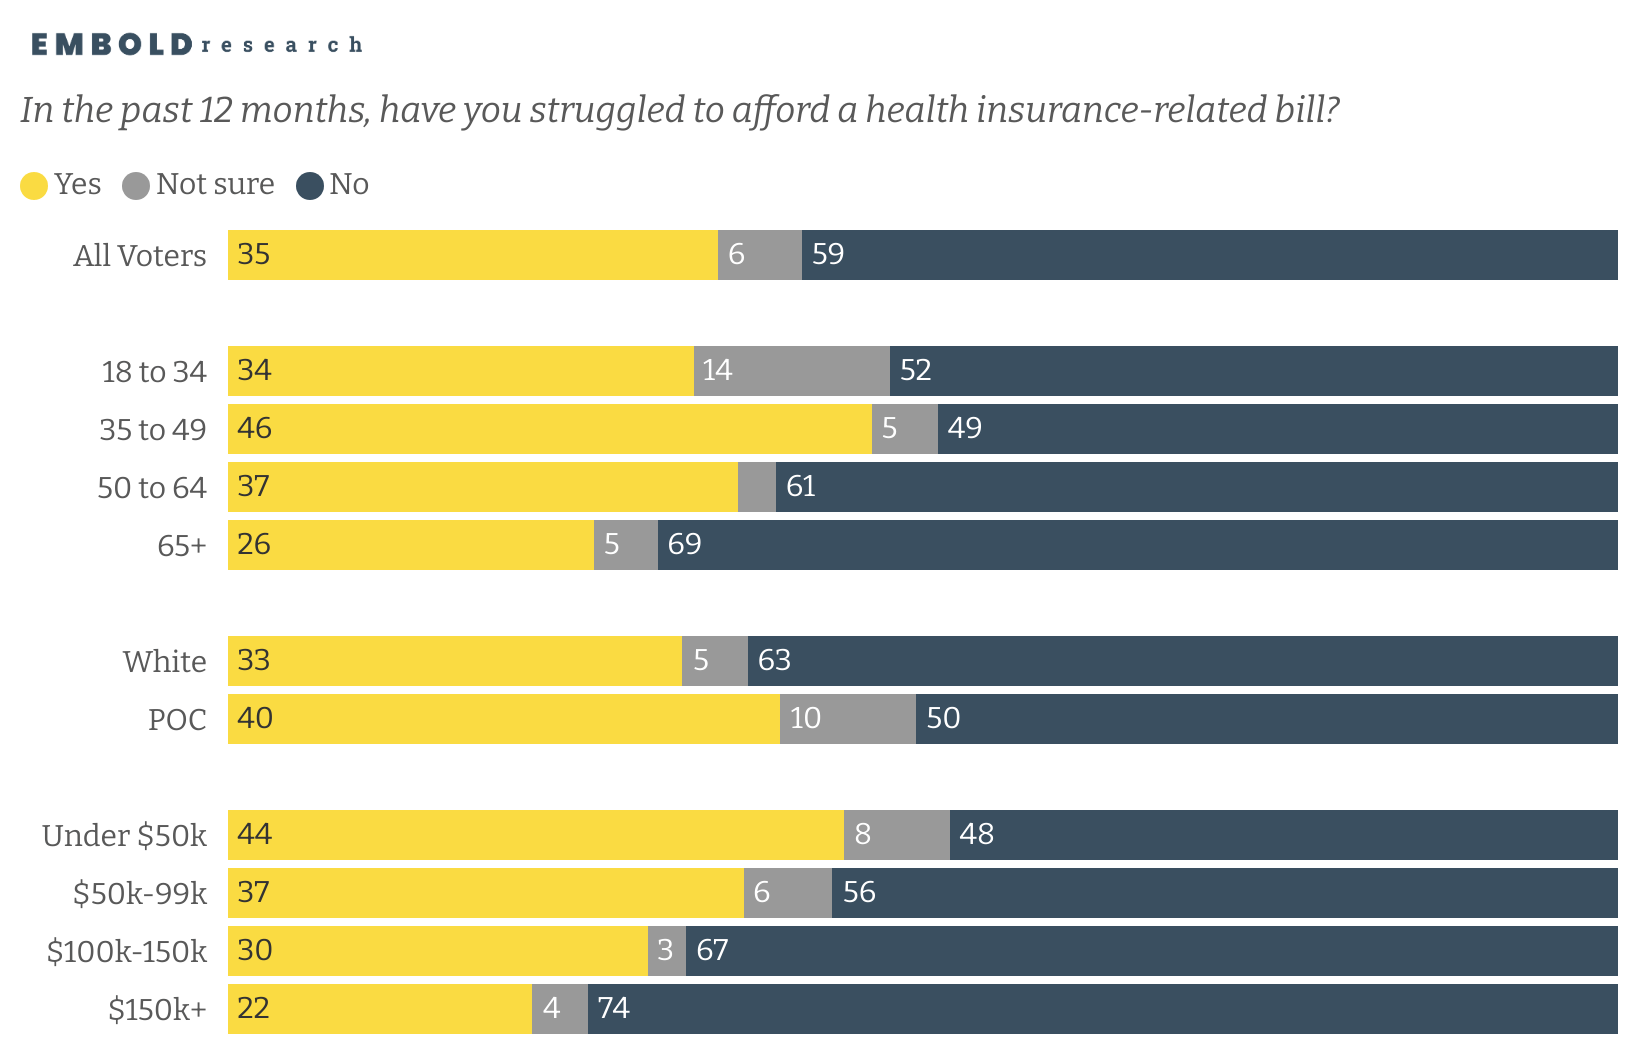
The financial strain is real: 35% of voters have struggled to afford a health-insurance-related bill in the past year, with higher rates among voters ages 35–49 (46%), voters under $50K (44%), and voters of color (40%).
 Among those who are insured, high premiums or deductibles are by far the most common frustration — cited by 57% of voters overall. The sting is felt most acutely by voters ages 35–49, the same group most dissatisfied with the value they get and most likely to struggle paying insurance-related bills. Generational differences extend beyond cost: voters under 35 are more likely than any other age group to point to poor provider networks (46%) and confusing paperwork or coverage rules (41%) as major issues. They are also more likely to report changes (35%) or gaps (34%) in coverage. Income patterns tell a similar story: voters earning under $50K are the most likely to name poor networks or limited providers (42%) as a top problem, while higher earners more often cite confusing rules and paperwork as their secondary concern.
Home Insurance: High Costs, Low Satisfaction
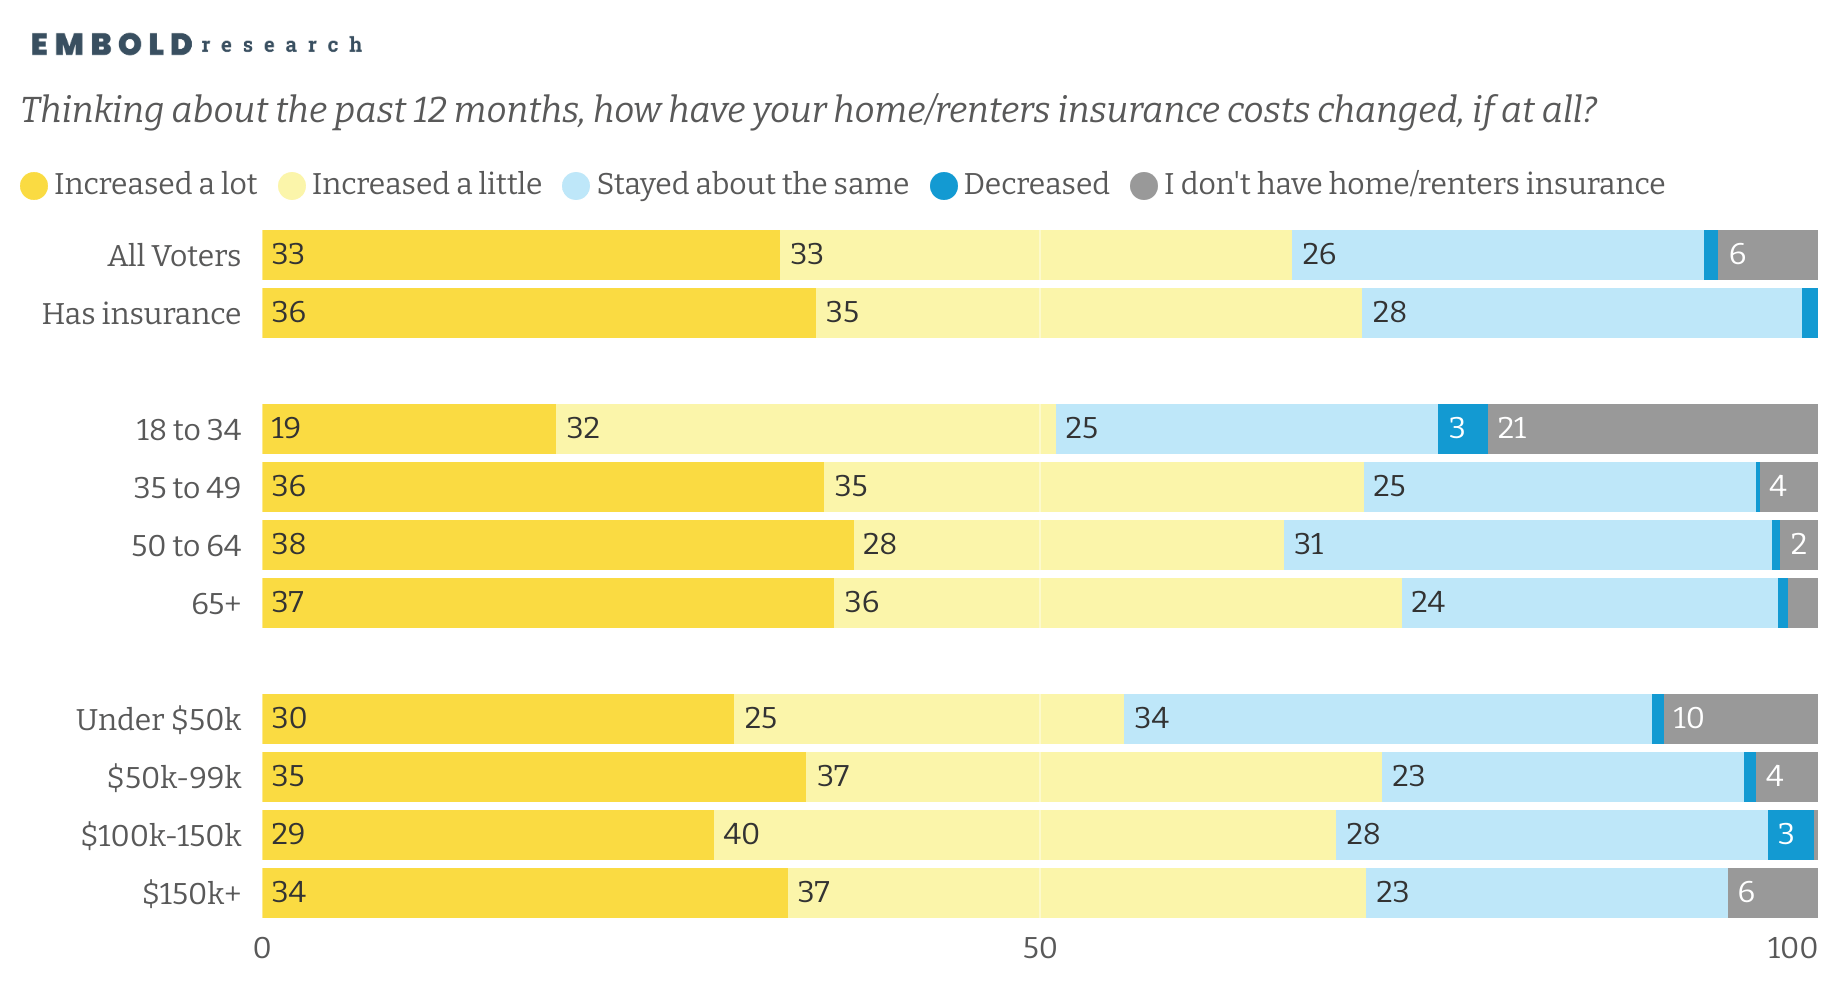
The housing insurance picture is more grim: 7 out of 10 voters with home or renters insurance have seen costs increase in the past year, with over a third (36%) saying they’ve increased a lot. Only 1% have seen a decrease.

Coverage gaps again appear among younger voters — over one in five under 35 have no renters or home insurance, compared to near-universal coverage among those over 35. Financial strain is less common than with health insurance but still significant: 26% have struggled to afford a housing insurance bill in the past year, rising to 38% among voters earning under $50K.
And in contrast to healthcare, few voters believe they’re getting their money’s worth on home or renters insurance. Only 22% agree they get good value for what they pay for home or renters insurance, while 41% disagree and 37% are neutral.

Cost dominates as the top concern for all groups, with 62% naming high premiums as their top concern when it comes to their housing insurance. Concerns about having to avoid using insurance to prevent price increases are also prevalent (31%), and disproportionately impact rural voters (37%).
These patterns underscore the prevalence of insurance costs and coverage gaps. Majorities report rising costs for both health and home insurance, and many — especially younger and lower-income voters — remain uninsured or underinsured. While satisfaction with health insurance is relatively high, dissatisfaction with the value of home insurance is widespread.
About the Survey
Polling was conducted online from August 5-10, 2025. Using Dynamic Online Sampling to attain a representative sample, Change Research polled 1858 registered voters nationwide. Post-stratification was performed on age, gender, race/ethnicity, education, region, urbanicity and 2024 presidential vote. You can see a full methodology statement here, which complies with the requirements of AAPOR’s Transparency Initiative. Members of the Transparency Initiative disclose all relevant details about our research, with the principle that the public should be able to evaluate and understand research-based findings, in order to instill and restore public confidence in survey results.
