Introduction
In 2022, Change Research celebrated our fifth birthday and went on to help hundreds of campaigns and organizations score big wins for their campaigns and issues in November.
Our team conducted over 550 polls, surveying over one million people in support of ballot measures, municipal and state legislative campaigns, issue advocacy organizations, candidates for governor, US Senate, and many more. Some highlights include:
- Helping Democrats win a majority of seats in the Pennsylvania State House for the first time since 2010 through our work with the Pennsylvania House Democratic Committee.
- Protecting 9 incumbents, holding 3 open Democratic seats, and flipping a Republican seat to protect the Democratic majority in the New Mexico State House.
- Launching the ‘Midterm Vibe Check’ with Teen Vogue, which spotlighted the powerful and decisive voices of Gen Z and Millennial voters.
- Supporting 16 Democratic state legislative caucuses, research consortiums, state parties, and state legislative independent expenditures with over 125 polls.
- Contributing to the re-elections of 10 Members of Congress, including US Rep. Lauren Underwood (IL-14) and Rep. Mary Gay Scanlon (PA-05).
- Supporting over 280 campaigns in 48 states, including Hawaii and Alaska!

Accuracy
Our clients use polls to understand the political environment they face and how, where, and on whom they should focus their communications and resources in order to prevail on Election Day. How close a poll comes to correctly anticipating the final election result is only one component of a poll’s purpose and value, but it is an important metric when evaluating whether a poll is accurately capturing public sentiment. As part of Change Research’s commitment to transparency and constant innovation, we conducted a deep dive analysis into Change Research’s polling accuracy in the 2022 Midterm elections.
This accuracy report will offer an analysis of Change Research pollsters’ accuracy in Congressional, State Legislative, County and Local, and Statewide races, in both our public and heretofore private polling.
We will discuss our highlights, explore a few case studies, and draw conclusions about what we learned from our polling in 2022. We then outline the steps we are taking at Change Research to continue refining our methodology.
Highlights

Congressional Districts
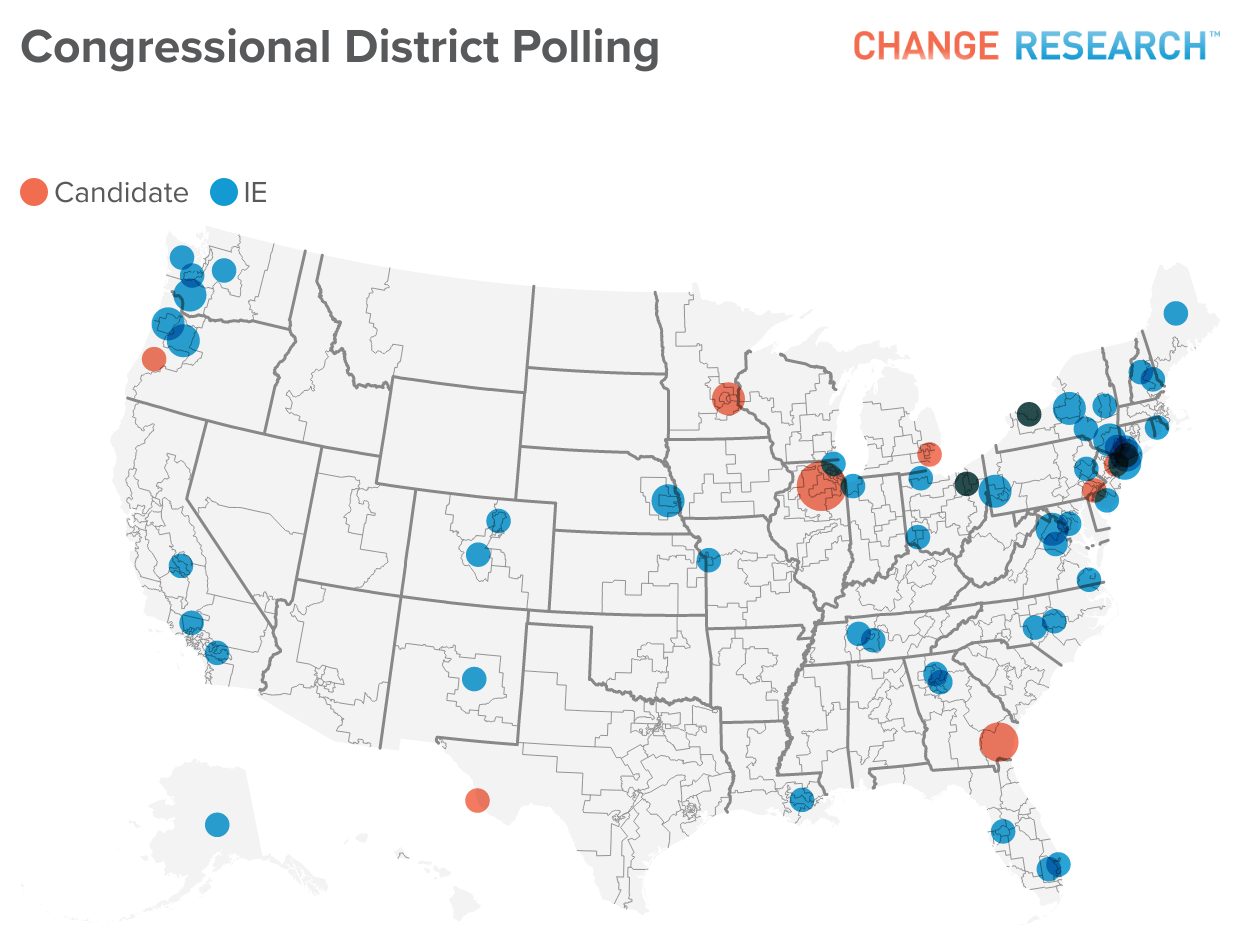
Throughout the 2021-2022 election cycle, we conducted 78 polls in 61 different congressional districts for both candidates and independent expenditures all over the country.

In the final 45 days of the campaign, we conducted 33 polls in congressional districts. Our overall absolute prediction error across those districts came in at 3.0 points. The chart below shows results versus the final ballot in our polls in these races.
“‘Our internal numbers were actually really accurate,’ said Ali Lapp, president of the House Majority PAC, which spent more than $180 million to help Democratic congressional candidates in 2022. ‘The problem was that nobody dared to believe them.’” –New York Times, 12/31/2022
In 20 polls for House Majority PAC, conducted from September 16th through October 19th, the absolute prediction error came in at 3.1 points. Moreover, we identified districts such as Washington’s 3rd where we found Democratic candidate Marie Gluesenkamp Pérez closing the gap to Republican Joe Kent from 47% to 41% on September 16th to 48% to 44% on October 8th. Those results led HMP to provide the support Perez needed to prevail 50.5% to 49.0% when voting ended.
Contrary to the “red wave” narrative dominating the coverage at the time, we found Wiley Nickel in North Carolina’s 13th, Susan Wild in Pennsylvania’s 7th, Yadira Caraveo in Colorado’s 8th, and Pat Ryan in New York’s 18th all within two to four points of their Republican opponents. Further investments by HMP allowed all of them to erase these deficits and go on to win.
State Legislative Districts
When Change Research launched in 2017, web panels dominated online polling. Panels cannot adequately survey a state legislative district, and live-caller polls have become too expensive to administer for many lower-budget campaigns. Our methodology of recruiting respondents to unique surveys allows us to poll in these races accurately and at an affordable price point.
Starting on July 6th and going through Election Day, we conducted 153 State House or Senate polls in 19 states. As expected, polling error decreased the closer we got to the end of voting: average error was 5.0 in 66 polls done in the last 45 days, and 3.2 in 27 polls performed in the last 30 days. Given the low name recognition of many State Legislative candidates, it is common to have a significant percentage of respondents indicate that they are unsure. Having high percentages of undecided voters is in itself an indicator of a race’s potential tightness and volatility. In the 58 polls in the last 45 days and 26 in the last 30 in which at least 80% of the voters had a preferred candidate, our average errors were 4.6 and 3.0, respectively.
In Pennsylvania, where Democrats took control of the House of Representatives for the first time in a decade, we conducted 38 polls across State House and State Senate races over the course of the summer and fall. Our average errors were 3.0 and 3.2 for the 18 and 13 State Legislative polls done in Pennsylvania in the last 45 and 30 days, respectively.
County and Local Races
As with state legislative districts, our technology allows us to poll representative samples of likely voters in counties, school board districts, city and county council districts, public service commission districts, and more. The races are often nonpartisan and have many more candidates than a traditional Democrat versus Republican general election contest further up the ballot.
In the 12 polls in the last 45 days in which at least 80% of the voters had a preferred candidate, our average error was 6.7.
Races of this nature are more difficult to poll due to candidates being less well known, multi-candidate fields, and not having partisanship to lean on to determine respondents’ adherence to or departure from previous voting patterns. We are proud to have assisted our local clients in honing their messages, targeting the right voters, and earning more than their fair share of upset victories.
Statewide Top-of-Ticket Races – U.S. Senate and Governor
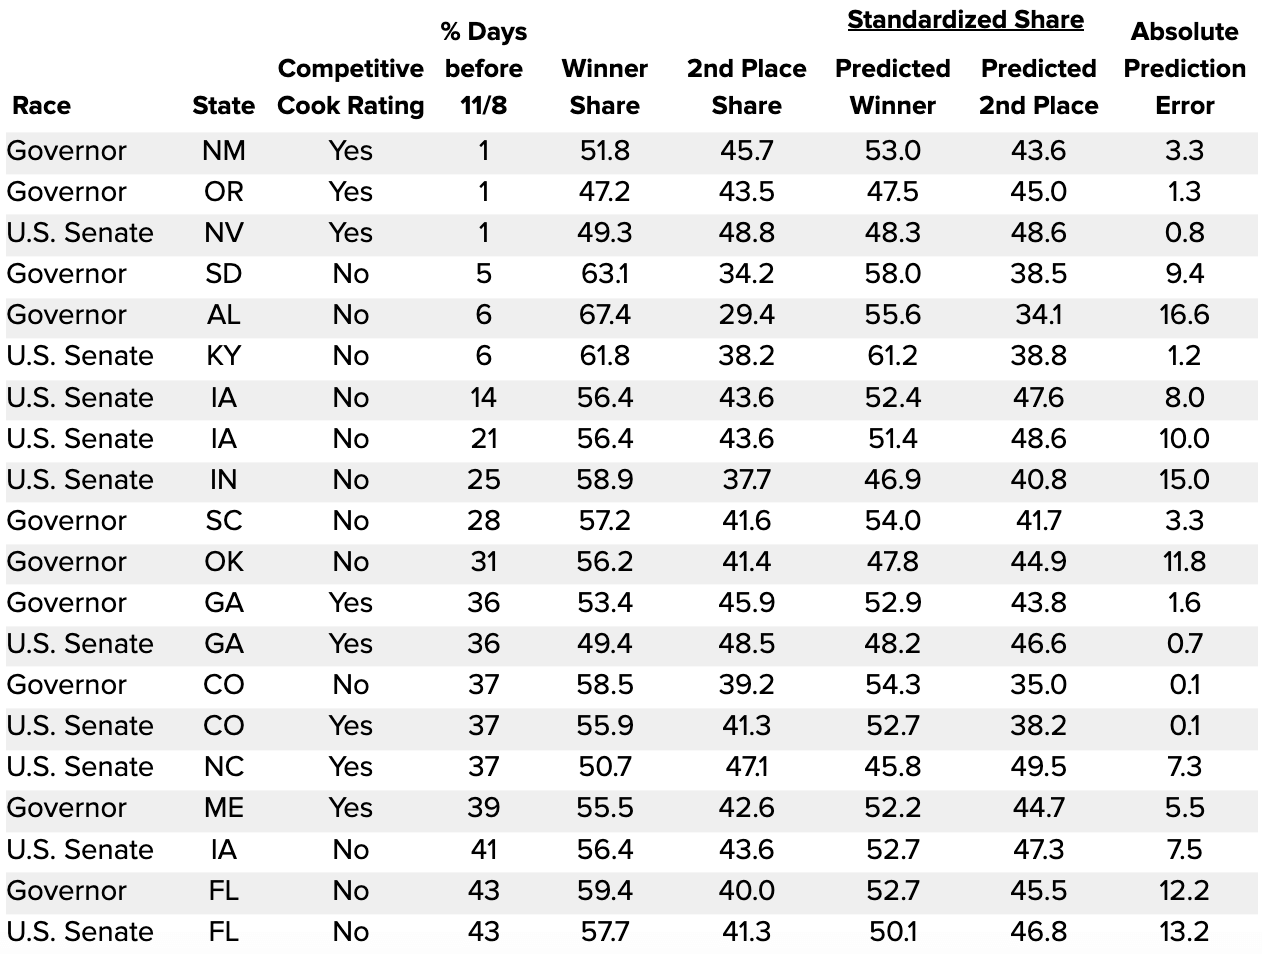
We conducted 20 statewide top-of-ticket polls in statewide elections in the last 45 days. Across those 20 races, we had an average error of 6.4 percentage points.
Many of those statewide polls were in non-competitive states. While we correctly predicted who would win each of those less competitive races, we tended to underestimate those winner’s vote share. For the 12 races that Cook Political Report classified as Solid or Likely races, our average absolute error was 9.0.
We were particularly accurate in tight races. In the 8 Senate and Governor races that Cook Political Report rated as Toss ups or Lean D/R that we polled in the final 45 days, our average error was 2.6 percentage points. In less competitive races, Republican incumbents expanded their margins as undecided voters came home at the end of the race.

Conclusion
As more and more campaigns come to rely on online polling, Change Research supports clients all over the country, many with limited resources, with accurate data and actionable advice to craft winning platforms, messages, and advertisements.
We are continuing to innovate on our methods to ensure that we remain on the cutting edge. In particular, we are taking the following steps:
- While the bulk of our surveys reach respondents via multiple modes, we are continuing to investigate new methods of reaching respondents, particularly those such as young voters or voters of color, that are hard to reach with more conventional methods. We are also continuing to update our targeting tactics, as well as iterating on the language used in our respondent recruitment.
- We are investigating including additional data to our deliverables that project the likely voting patterns of undecided voters based on their partisanship and answers to other questions. We believe this will help indicate when undecided voters are likely to break in a consistent direction.
