Introduction
2024 validated Change Research’s track record of polling precision. Our polling was consistently close to the final margin in races at the top and bottom of the ballot, often nailing a race exactly. This helped us continue our mission of supporting hundreds of campaigns and organizations to understand the dynamics of their races so that they could overperform and score big wins.
In 2024, our team conducted over 370 general or primary election polls, surveying over 680 thousand voters for ballot measures, municipal and state legislative campaigns, issue advocacy organizations, candidates for the US House, US Senate, and many more.
Some highlights include:
- Working with 237 campaigns and organizations supporting candidates up and down the ballot in 43 states.
- Helping Democrats keep their one-vote majority in the Pennsylvania State House.
- Supporting Ohio House Democrats in picking up seats in the Ohio House of Representatives.
- Protecting ALL vulnerable Democratic seats and reducing the GOP majority in the Tennessee House.
- Protecting Democratic majorities in the New Mexico State House and Senate.
- Electing pro-abundance local candidates and supporting a variety of winning independent efforts and ballot measures in the San Francisco Bay Area.
- Performing deep messaging work on movable voters in the presidential election with Future Majority and Worthy Strategy’s “Kamala Connect” series.
- Over 80 mentions by national, regional, and local media outlets of the work and success of Change Research and our nonpartisan arm, Embold Research.

Our clients use polling to understand the political environment and improve targeting efforts (how and where to focus communications and resources) in an effort to prevail on Election Day. Correctly anticipating the final election result is only one component of a poll’s purpose and value. As part of Change Research’s commitment to transparency and constant innovation, we conducted a deep dive analysis into Change Research’s polling accuracy in the 2024 election as we do after each election cycle.
This report offers an analysis of Change Research’s accuracy across races ranging from Presidential to hyperlocal, such as city council and school board, in both our public and heretofore private polling. We will discuss our highlights, explore a few case studies, and draw conclusions about what we learned from our polling in 2024. We will also outline the steps we are taking at Change Research to continue refining our methodology.
The methodology used to calculate our error metrics can be found at the end of this document.
Highlights – Last 30 Days
U.S. President
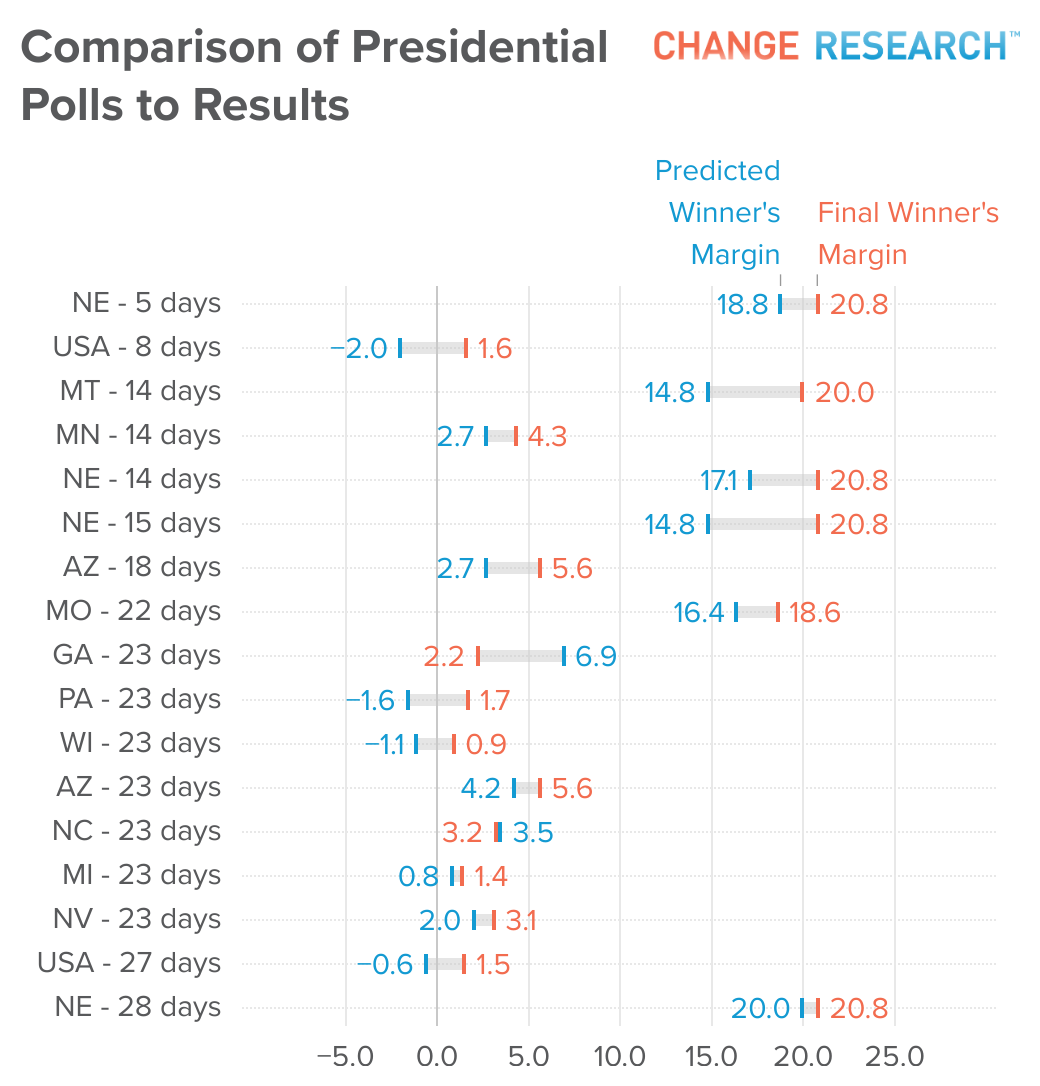
Over the last 30 days of the campaign, Change Research ran 17 national and statewide polls that asked about the Presidential race. On average, our predicted margin came within 2.6 points of the final results. In all of these states, we never saw Kamala Harris with a lead outside of the margin of error.

U.S. Senate
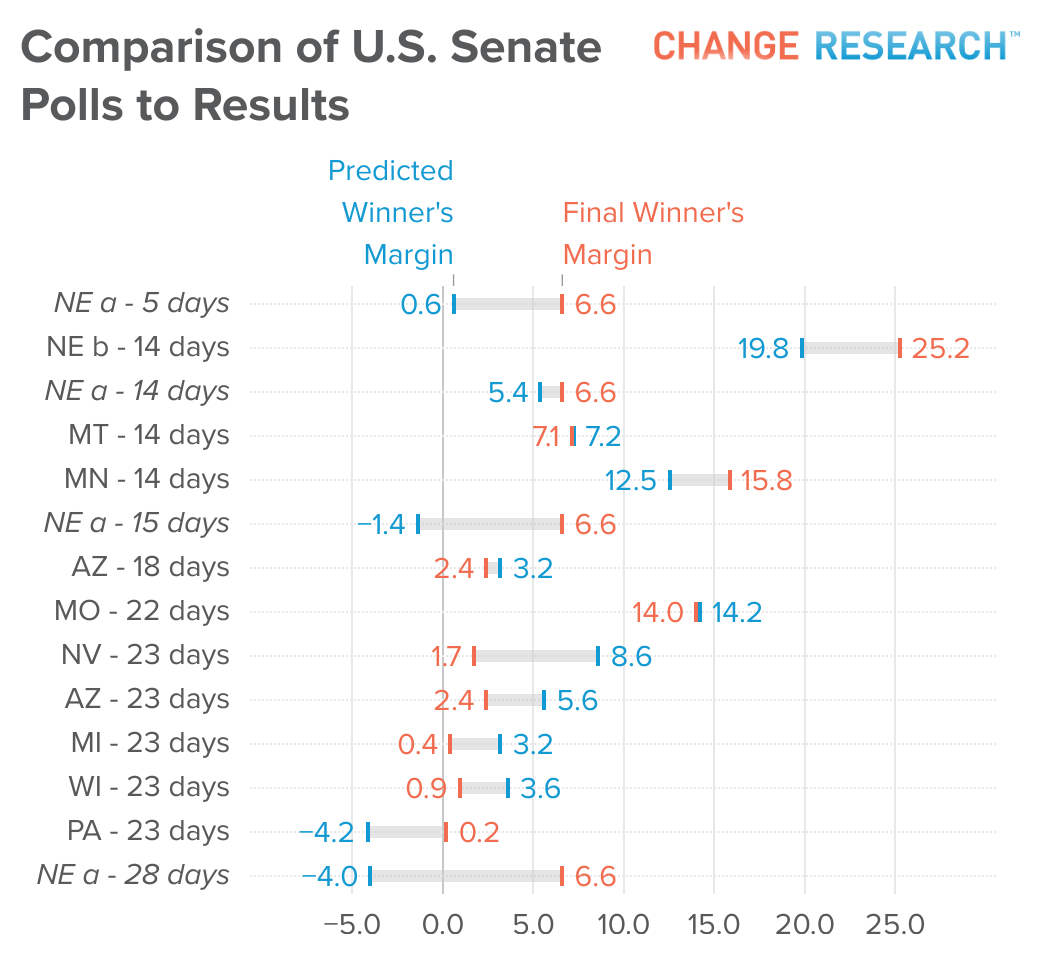
In races for the U.S. Senate, Change Research conducted 14 polls over the last 30 days of the electoral cycle. On average, the polls came within 4 percentage points of the winner’s final margin, including predicting the final margin within 1 percentage point in our final polls in Montana, Arizona, and Missouri.

Throughout the 2024 cycle, Change Research conducted the majority of polling for the Nebraska “A” race between Independent Dan Osborn and Republican incumbent Deb Fischer. Polling consistently showed this race as competitive. Osborn performed notably well compared to other Democratic candidates nationally despite raising and spending considerably less money.
However, the polls indicated a challenging landscape: over 80% of undecided voters were likely to support the Republican candidate, mirroring patterns seen in similar Independent vs. Republican races in deep red states like Utah (2022) and Kansas (2014). This trend typically results in Independents receiving limited crossover support from undecided voters.
State Legislative Districts
When Change Research launched in 2017, web panels dominated online polling. However, panels cannot adequately survey a state legislative district, and live-caller polls have become too expensive for all but the most cash-rich campaigns. Change Research’s methodology of recruiting fresh respondents to each survey allows for accurate polling at an affordable rate.
From September 1st through Election Day, we conducted 83 State House and Senate polls in 16 states. For many of these polls, we interviewed 300 people or fewer. These small surveys typically have large margins of error of six to eight percentage points or higher. For 2024 our average error in predicting the margin was just 3.8 points. As expected, polling errors decreased towards the end of the election season. The average Change Research polling error was 3.0 in 53 polls performed in the last 30 days.
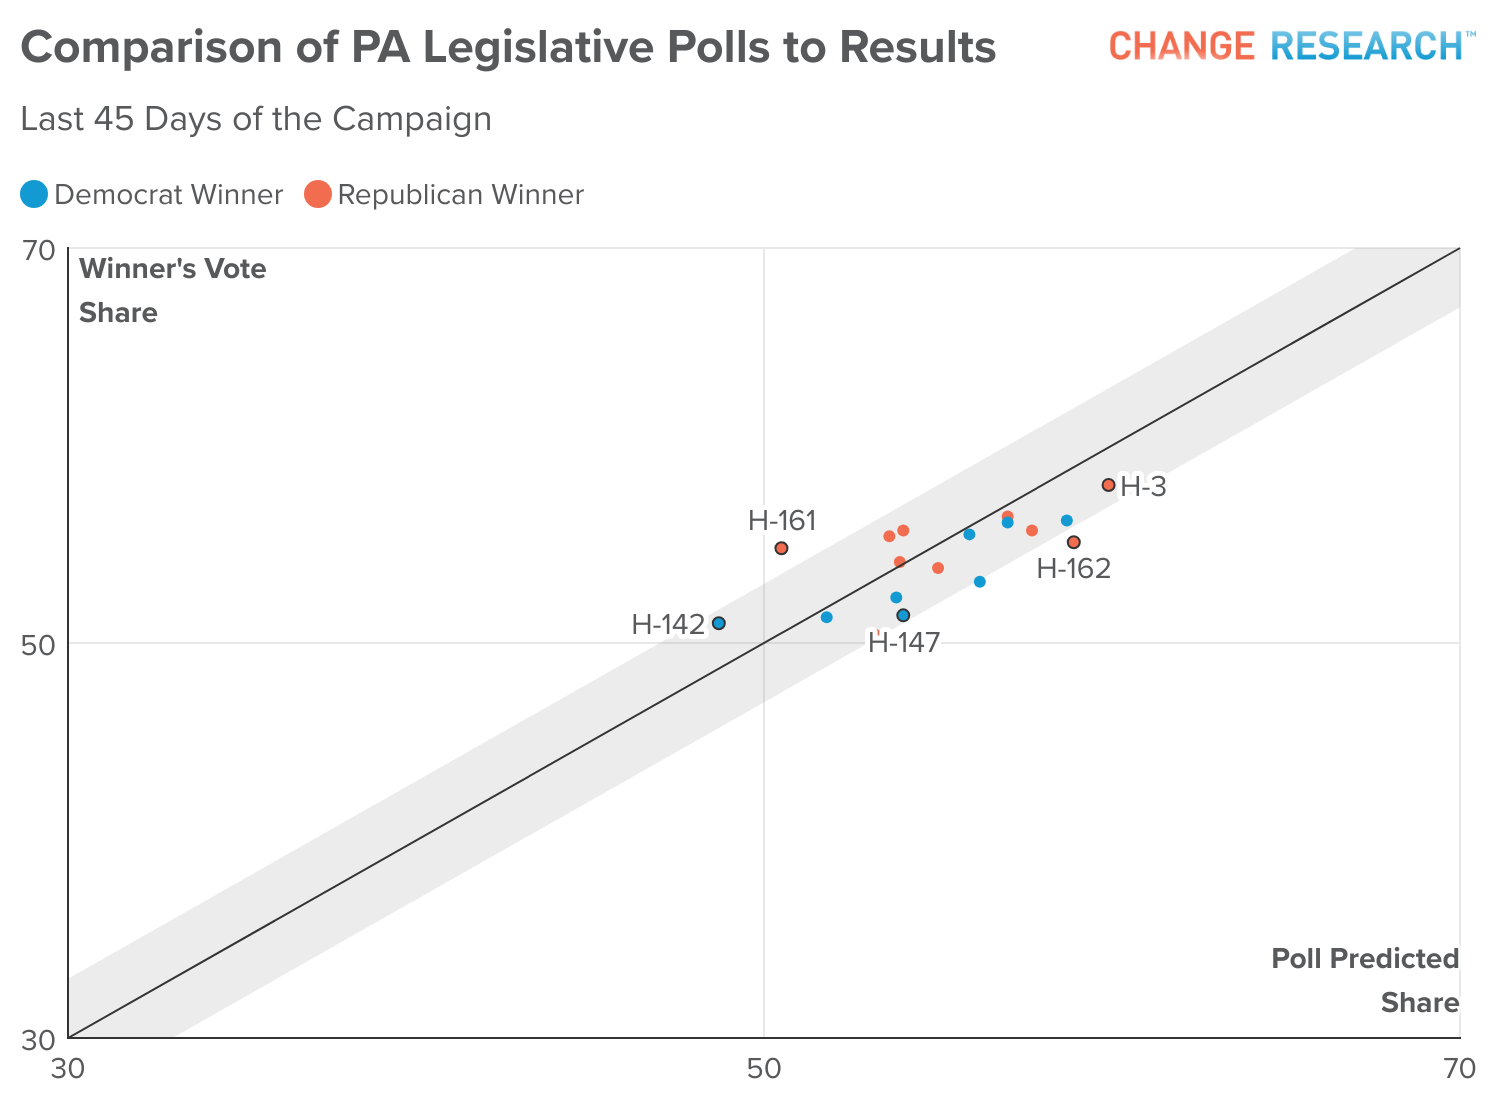
In Pennsylvania, Democrats took control of the State House of Representatives for the first time in 2022, winning by just one seat. In 2024, CR conducted 30 polls across State House and Senate races, and our work helped to support the maintenance of this margin in a very unfavorable political environment. Our average error was 3.8 for the 18 polls completed in the last 30 days of the election.

In other states where we polled frequently, we were even more accurate:
County and Local Races
As with state legislative districts, Change Research’s technology allows us to poll representative samples of likely voters in counties, school board districts, city and county council districts, public service commission districts, and more. The races are often nonpartisan and have many more candidates than a traditional Democrat versus Republican general election contest further up the ballot. We also regularly poll in races with complicated ballot designs, such as Ranked Choice voting where voters rank several candidates in order of preference, and complex mathematical procedures are used for counting.
Races of this nature are more difficult to poll because the races are often non-partisan, many candidates are less well-known, and there are multi-candidate fields. In the 12 ranked-choice election polls from September 1st to Election Day in races where at least half of voters held a preference, our average error was 8.2 points.
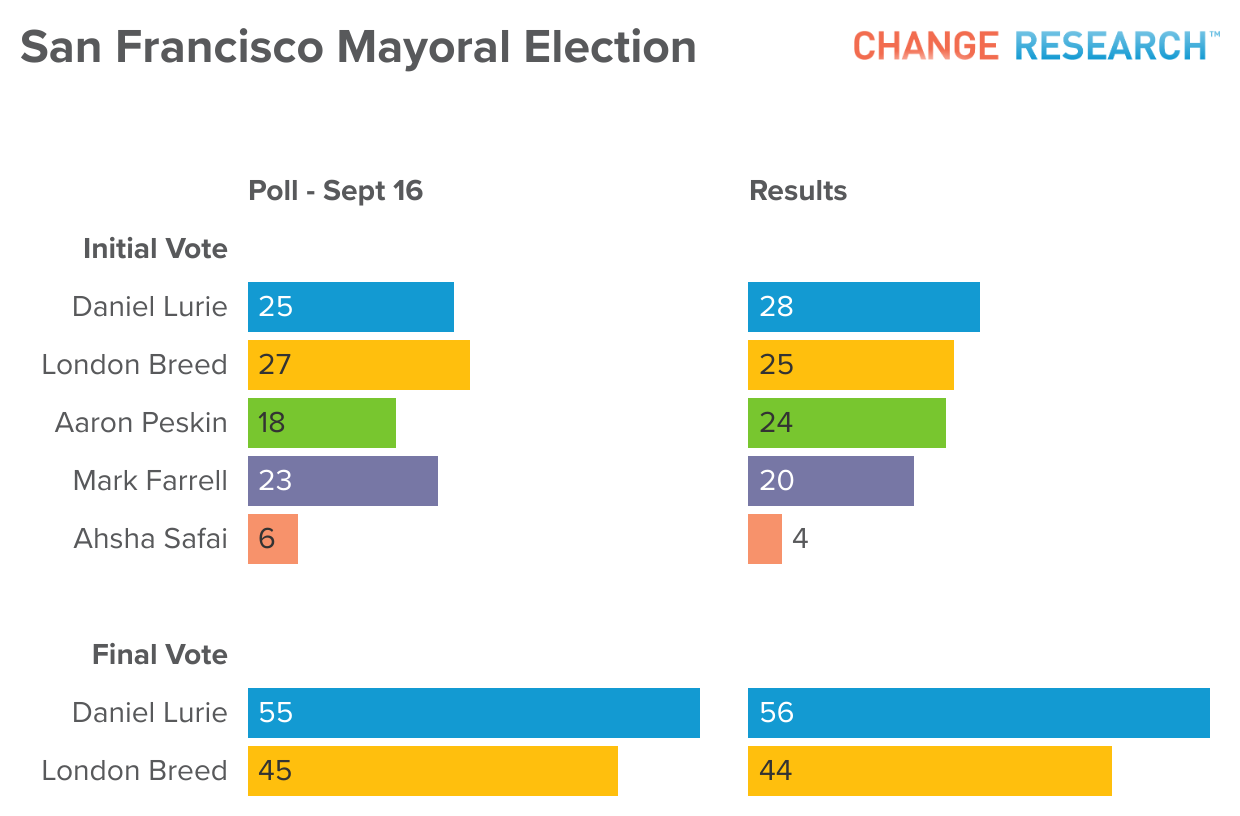
In a ranked-choice election, in San Francisco, we conducted a poll from September 10th through 16th. In the initial vote, we had the two leading candidates – Mayor London Breed and the eventual winner Daniel Lurie – within two points of each other and estimated the final ballot vote margin between the two within a point of the final result.

Change Research is proud to have assisted our local clients in honing their messages, targeting the right voters, and earning several upset victories.
Change Research supports forward-thinking clients all over the country. We provide accessibility to fast, accurate data, along with actionable advice to craft winning platforms, messages, and advertisements.
We are continually innovating our methods to remain at the forefront of research. Our artificial intelligence tools allow our customers to query our extensive respondent database to uncover deeper insights into political trends and understand how voters interpret and engage with information and language. And we plan to keep redefining the way public opinion is measured in 2025 and beyond.
We’re grateful for all the candidates, causes, and organizations that we’ve worked with in 2024 to help make the world a little more humane, scientific, and just.
Report Methodology
Calculation of Number of Polls
Many of our surveys ask about more than one election and we frequently run more than one survey for a given race during an election cycle. The number of polls quoted throughout this document refers to the total number of horse race questions asked. For example, the 14 U.S. Senate poll numbers for the last 30 days indicate that we asked a total of 14 U.S. Senate horse race questions across all of our conducted surveys although some surveys asked about more than one horse race and we polled the same race multiple times.
Poll Timing
When measuring when a poll was completed for this document, we use the date that we completed fielding a poll. For example, if a poll finished fielding on November 3, 2024, we would classify it as completed 2 days before the election.
Calculation of Error Metric
For this analysis, we used FiveThirtyEight’s measure of accuracy and calculated our deviation from the final margin of the top two candidates. While giving respondents an option to say that they are undecided in their candidate choice is vital when conducting a survey, when it comes to election day, only the votes of those that vote for one of the candidates are recorded. As such, when calculating the margin in our poll results, our prediction includes only respondents who chose a candidate. A hypothetical example of how this works is given below.
For the final calculation of error, we use standardized results that exclude undecided voters. Since the final margin between candidate A and B was 4.2 percentage points and the margin in the normalized poll results was 6.2 percentage points, we would record an absolute error of 2.0 percentage points for this poll.
