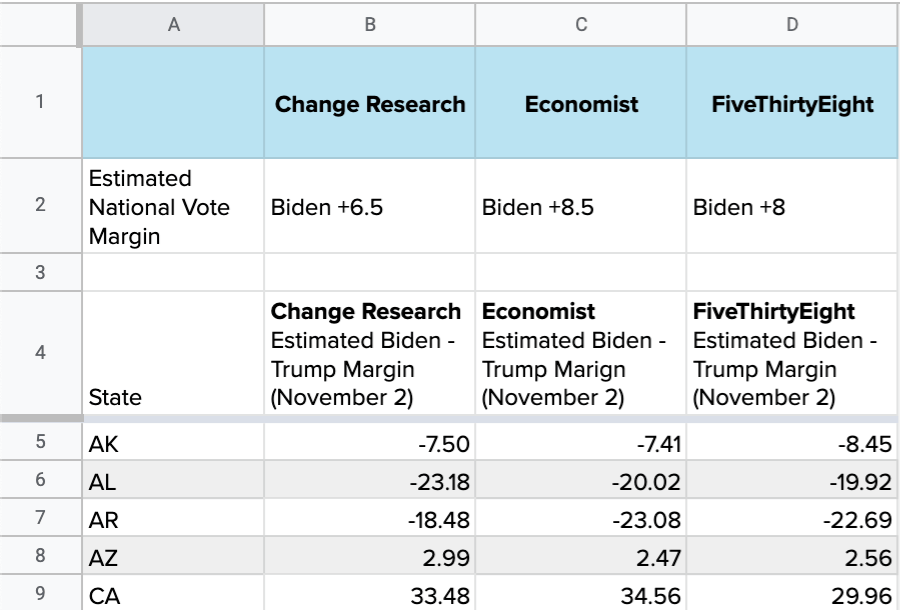
Prior to the 2020 Presidential election, Change Research released our modeled 2020 Presidential vote estimates by state. The model had a statewide average error of 3.59 points, more accurate than poll-based models from The Economist and FiveThirtyEight.
This spreadsheet contains Change Research modeled estimates for all 50 states. This spreadsheet contains the model’s accuracy for all 50 states, based on 2020 election results.
While other 2020 election models aggregate poll results, our model is built exclusively from our own polling data. The model is based on the responses we have collected from over 250,000 voters about who they are planning to vote for in the upcoming Presidential election.
Our model allows us to forecast presidential vote share in places where we have very little or no polling at all. For instance, we only have 82 people who have taken one of our surveys in Wyoming, and our modeling allows us to estimate what the vote share will look like.
Different from other election models, though, since we are using individual responses to surveys rather than aggregated poll results, our model can estimate vote share for subgroups of the population, including subgroups most likely to decide this election’s outcome. Below our estimates of the margin a group will support Biden over Trump for a few pivotal subgroups.
Modeling at Change Research
At Change Research we believe that modeling can help campaigns and organizations make better use of their polling data. We find it is helpful to separate models into two separate categories: aggregate models and individual models.
Aggregate models
Aggregate models are great for understanding the behavior of a group of people. Our 2020 Presidential model is a great example of an aggregate model. We are interested in vote share for different groups of people. Aggregate models allow us to understand differences across geographies or groups of people.
Aggregate models are particularly useful for resource allocation decisions. If you want to know which county or which group of people to allocate your resources towards, aggregate models can provide accurate answers.
Individual Models
At Change Research, we have also seen great success with individual models. Individual models predict the probability that individuals will have certain attributes. These models are great when you want to find the best individuals to target. Rather than targeting females over the age of 65, we can give detailed guidance on which individuals to target.
How does the presidential vote model work?
Our model works by breaking the population into different subgroups. We stratify the population along a number of different qualities including age, ethnicity, and education. For each subgroup we estimate the percentage of people in that subgroup we believe will vote for Biden. For this model we removed third party vote and undecided respondents so we are only looking at Biden’s vote share out of vote that goes to either Biden or Trump, which lets us estimate Biden’s margin over Trump.
We then combine this percentage with our turnout model which we use to estimate what proportion of the voting population each of these subgroups make up. We can then aggregate these numbers to get estimates for any group of interest.
In April, we began asking voters about who they would vote for in 2020 between Biden and Trump. This model is trained on data from polls we have run since then.
Because these models are constructed from a large numbers of polls, most of which are not public, they may not line up with Change Research polls that are released publicly.

